– Dow -500, S&P Breaks Below Key Technical Support As 10Y Yield Tumbles
* * *
PayPal: Donate in USD
PayPal: Donate in EUR
PayPal: Donate in GBP
The man who trades freedom for security does not deserve nor will he ever receive either. – Benjamin Franklin

– Trump Now Live-Tweeting The Market: “Record High For S&P 500”:
Apparently, having nothing else to comment on this morning, moments ago the president tweeted that as of this moment, the S&P just hit its latest, 40th YTD, all time high in 2017.
“RECORD HIGH FOR S & P 500!”
RECORD HIGH FOR S & P 500!
— Donald J. Trump (@realDonaldTrump) September 29, 2017
Putting this declaration in context, in April 2016, Trump was feeling increasingly bearish about stocks. He told The Washington Post that they were overvalued and that the strong data that showed a healthy economy were essentially phony.
“I think we’re sitting on an economic bubble. A financial bubble,” Mr. Trump said.
By September, he was arguing that the Federal Reserve was propping up a “false economy” that is actually weak.
Read moreTrump Now Live-Tweeting The Market: “Record High For S&P 500!”

– Tech Stocks Experience Their Longest Losing Streak In 5 Years As Panic Begins To Grip The Market:
S&P 500 tech stocks have now fallen for 9 days in a row. The last time tech stocks declined for so many days in a row was in 2012, and that was the only other time in history when we have seen such a long losing streak. As I have stated before, the post-election “Trump rally” is officially done, and the market is starting to roll over as investors begin to realize that all of the buying momentum has completely evaporated. Tech stocks tend to be particularly volatile, and so the fact that they are starting to lead the way down should definitely be alarming to many in the investing community.
Of course it isn’t just tech stocks that are falling. The Dow was down another 59 points on Wednesday, and the S&P 500 has closed beneath its 50 day moving average for the very first time since the election. For those that have been waiting for a key technical signal before getting out of the market, there is one for you.
– Factory Orders Plunge For 20th Month In A Row – Longest Streak In US History:
Despite a small beat in MoM data (-1.5% vs -1.9% exp), US factory orders plunged 5.6% YoY – the worst drop since September 2015. This extends the period of annual contraction to 20 months – a record streak of declines in US history and one which has always, without exception, coincided with recession…
The big drop was driven by a plunge in non-defense aircraft and parts… (even with a surge in car orders)
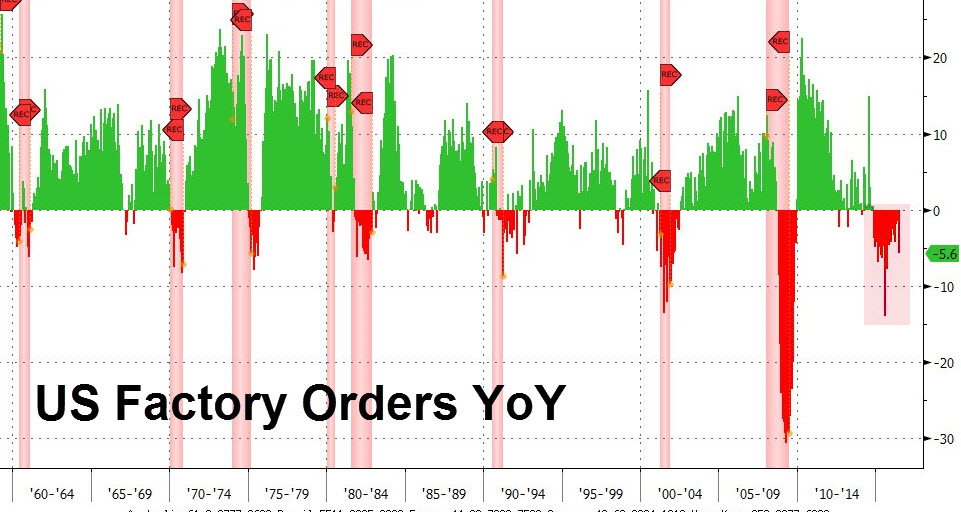
It’s probably nothing though…

– Tuesday Humor: What’s Wrong With This Chart?:
Sorry but seriously!!

The average forward price-earnings ratio for the Energy sector has been 15.8x.
At the current 97x forward P/E, S&P Energy stocks trade 20 standard deviations rich to history!!
* * *
PayPal: Donate in USD
PayPal: Donate in EUR
PayPal: Donate in GBP
– Panic!! All Major US Equity Indices Halted (ZeroHedge, Aug 24, 2015):

Nasdaq was the first to be halted at 0758ET.
The Dow is now down 850 points from Friday’s close and halted…
The S&P 500 Futures is halted for the first time in history.
– S&P 500 Breaks Below 2,000, Crashes Into Red Year-Over-Year (ZeroHedge, Aug 21, 2015):
The S&P 500 index has broken below the crucial psychological 2,000 level for the first time since late January. This is the biggest collapse in stocks since June 2013 (bigger than October’s plunge – which was only rescued by Bullard’s threat of QE4). What is perhaps most worrisome for the trend-followers – the S&P is now down year-over-year for the first time since May 2012… which once again brought The Fed out with moar QE.
The S&P 500 has broken below the crucial 2,000 level…
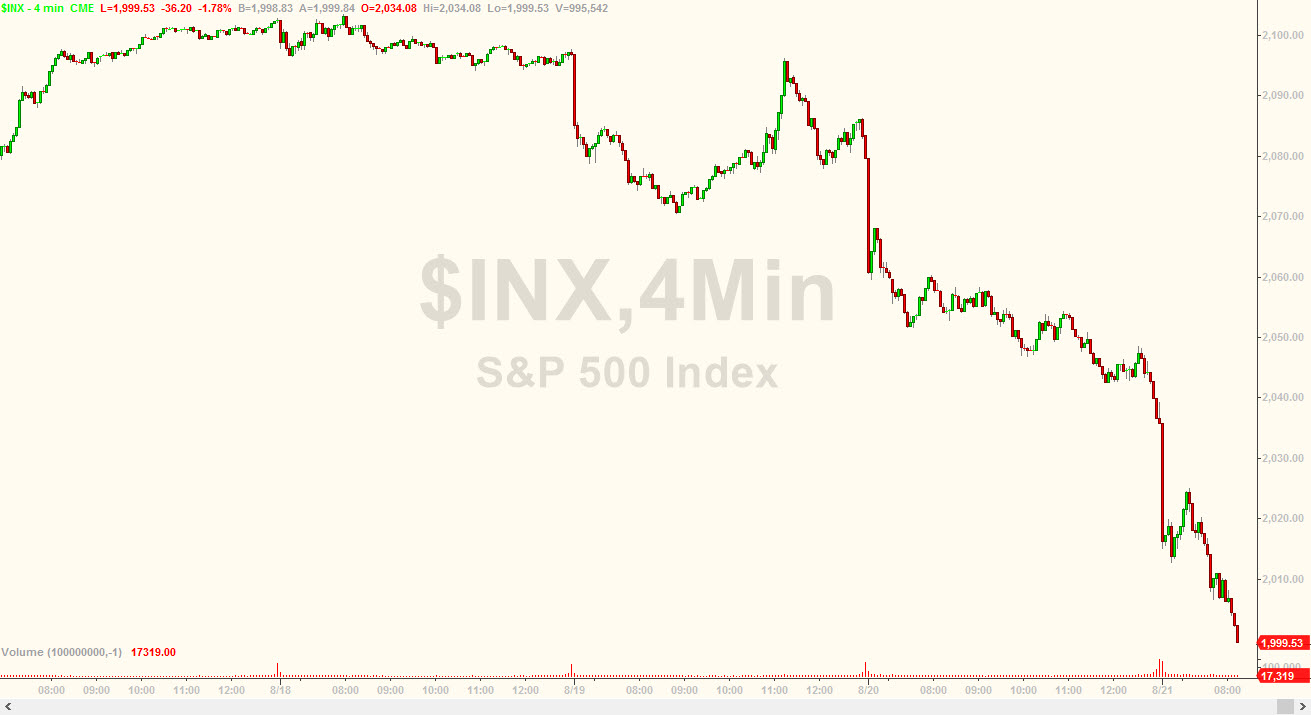
And The S&P 500 is now down YoY for the first time since May 2012…
Read moreS&P 500 Breaks Below 2,000, Crashes Into Red Year-Over-Year

– S&P 500 Tumbles Into Red For 2015, Breaks Below Key Technical Support (ZeroHedge, Aug 7, 2015):
The S&P 500, having broken below its 200-day moving average again, has joined The Dow Transports, Dow Industrials, and Russell 2000 (small caps) in negative territory year-to-date…
…
– 30Y Treasury Yield Plunges To 3-Month Lows As S&P Breaks Key Technical Support (ZeroHedge, Aug 3, 2015):
The carnage is contagious. The S&P 500 just broke down below its 50- and 100-day moving averages unable to hold the ubiquitous pre-EU-close ramp highs. Treasury yields have plunged since the weak spending and ISM data with the 5Y breaking below its 200-day moving average and 30Y yields testing 3-month lows…
…
For your entertainment.
When will the “market” crash?
Directly after Lord Rothschild has given orders to press the sell button.
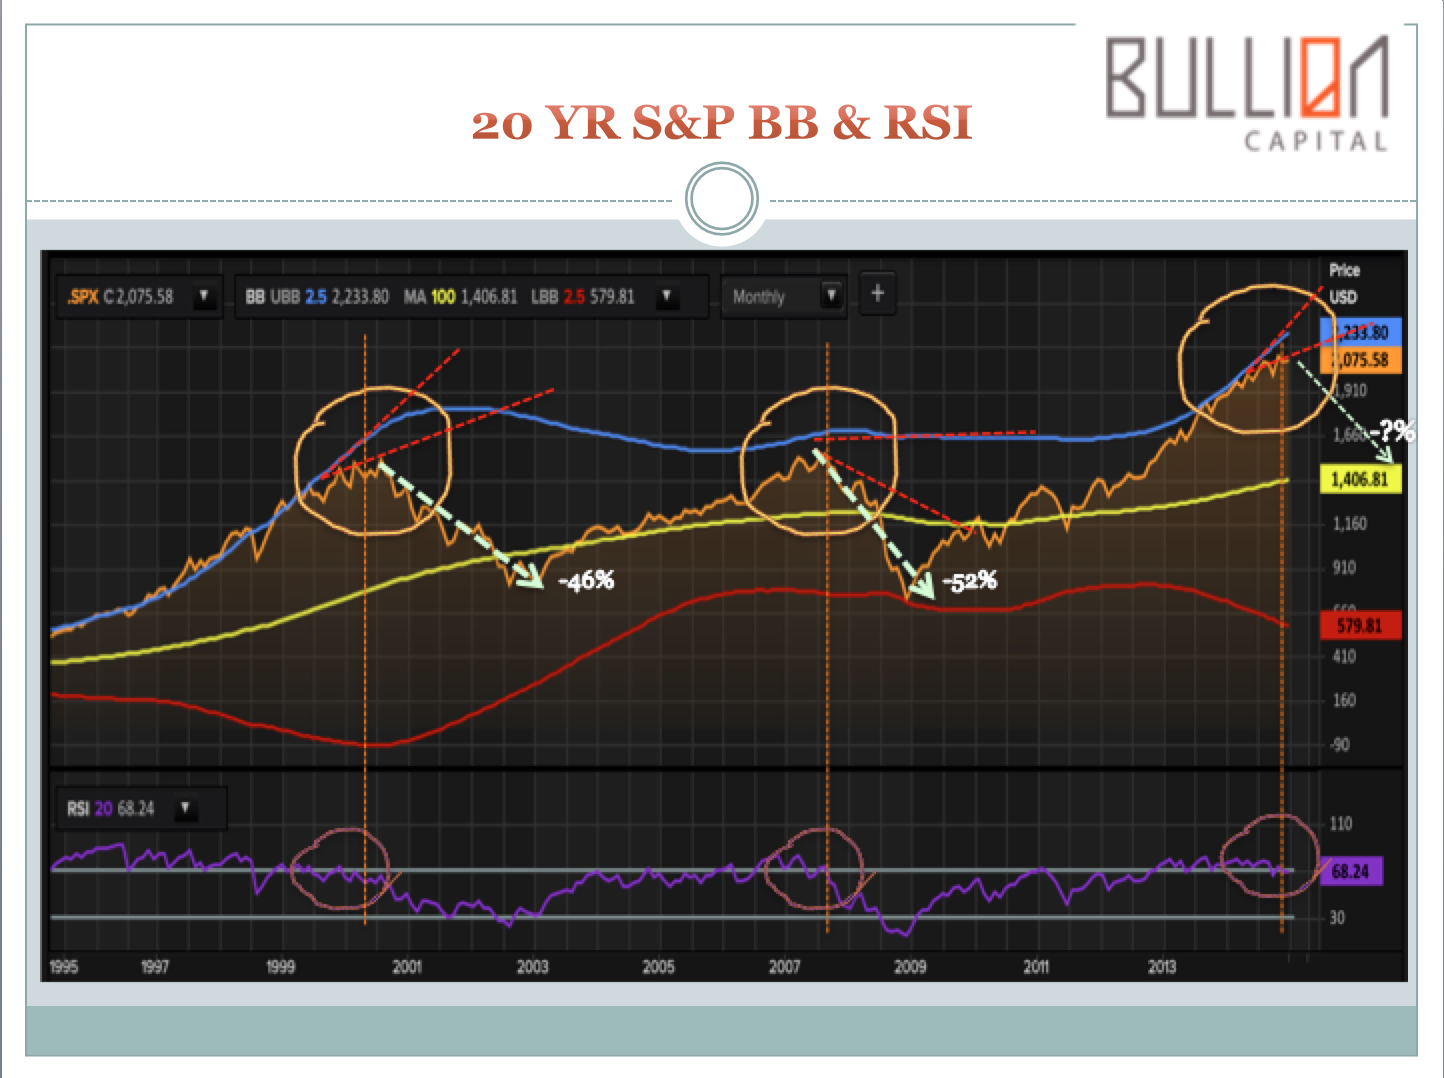
– This Technical Signaled The Last Two Market Crashes And It Just Happened (ZeroHedge, April 17, 2015):
So the fundamental case for a 20 year bull run as BMO is calling for and certainly many other banks seem to be onboard with that is not looking great YTD. In fact, most perma bulls have shy’d away from even mentioning fundamentals other than to say that generally they aren’t looking great but don’t worry the Fed is still engaged. And so I feel its a worthwhile exercise to have a look at the technicals. Thing about the technicals is that you can cherry pick any baseline point to really make any case, good or bad. But if we take a look at a time period that encompasses several cycles we negate our ability to cherry pick the baseline and we can be much more confident in our overall analysis.
Read moreThis Technical Signaled The Last Two Market Crashes And It Just Happened

– Guess What Happened The Last Two Times The S&P 500 Was Up More Than 200% In Six Years? (Economic Collapse, March 11, 2015):
Just a few days ago, the bull market for the S&P 500 turned six years old. This six year period of time has been great for investors, but what comes next? On March 9th, 2009 the S&P 500 hit a low of 676.53. Since that day, it has risen more than 200 percent. As you will see below, there are only two other times within the last 100 years when the S&P 500 performed this well over a six year time frame. In both instances, the end result was utter disaster. And as you take in this information, I want you to keep in mind what I said in my previous article entitled “7 Signs That A Stock Market Peak Is Happening Right Now“. What we are witnessing at this moment is classic “peaking behavior”, and there is a long way to go down from here. So if historical patterns hold up, those with lots of money in the stock market could soon be in for a whole lot of trouble.
Read moreGuess What Happened The Last Two Times The S&P 500 Was Up More Than 200% In Six Years?
– S&P Down 5% From Highs, Dow Drops Almost 700 Points In 27 Hours (ZeroHedge, Jan 14, 2015):
Things are escalating… Energy credit markets are pushing back towards record high spreads, copper is pushing back to the overnight lows and gold and silver are flat. US equity markets are the big movers with The Dow down well over 300 points today (and nearly 700 points in the last 27 hours) and the S&P now down almost 5% from its highs. Treasury yields are 8-10bps lower on the day with 30Y yields at record lows and 10Y close.
…

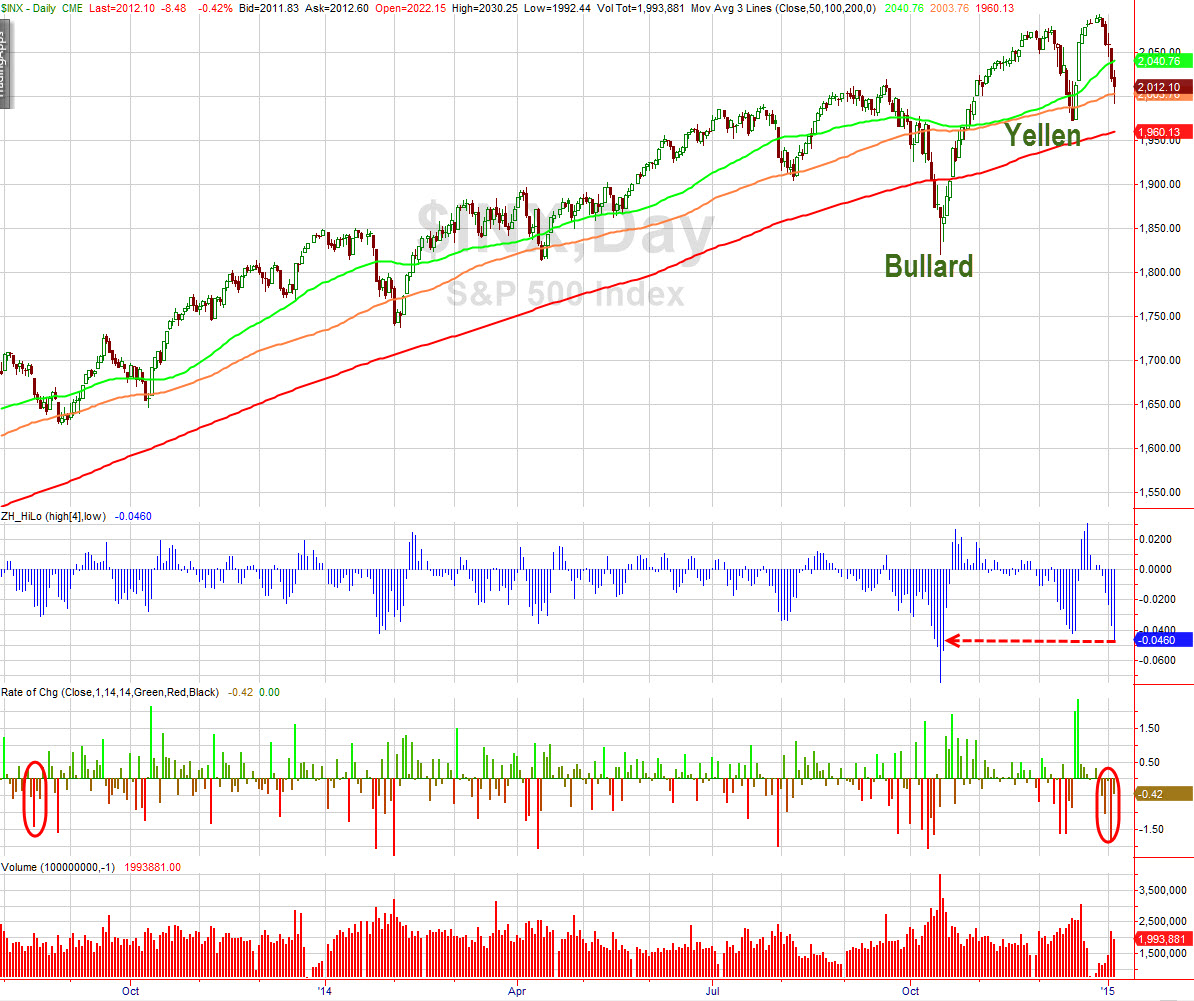
– Worst Start To A Year Ever, Stocks Down 5 Days In A Row (Zerohedge, Jan 6, 2015):
How many are feeling after the worst 3-day start to a year EVER…
Market internals triggered a 2nd Hindenburg Omen…

The S&P 500 is down 5 days in a row – the first time since Sept 2013… with the biggest 5-day decline since Jim Bullard saved the world… (finding support at its 100DMA for now)
– Blackrock Stunner: S&P 500 Profits Are 86% Higher Than They Would Be Without Accounting Fudges (Zerohedge, Dec 26, 2014):
“It becomes tempting to take on too much leverage, use financial wizardry to reward shareholders or even stretch accounting principles. S&P 500 profits are 86% higher than they would be if accounting standards of the national accounts were used, Pelham Smithers Associates notes. And the gap between the two measures is widening, the research firm finds.” – Blackrock
– WTI Crude Slides Below $81 (ZeroHedge, Oct 22, 2014):
It appears some of the ‘fundamental’ legs of the face-ripping ramp in stocks are fading. Broken Markets – nope; Fed Speakers – nope (blackout period); Crude rising – nope (WTI back under $81)
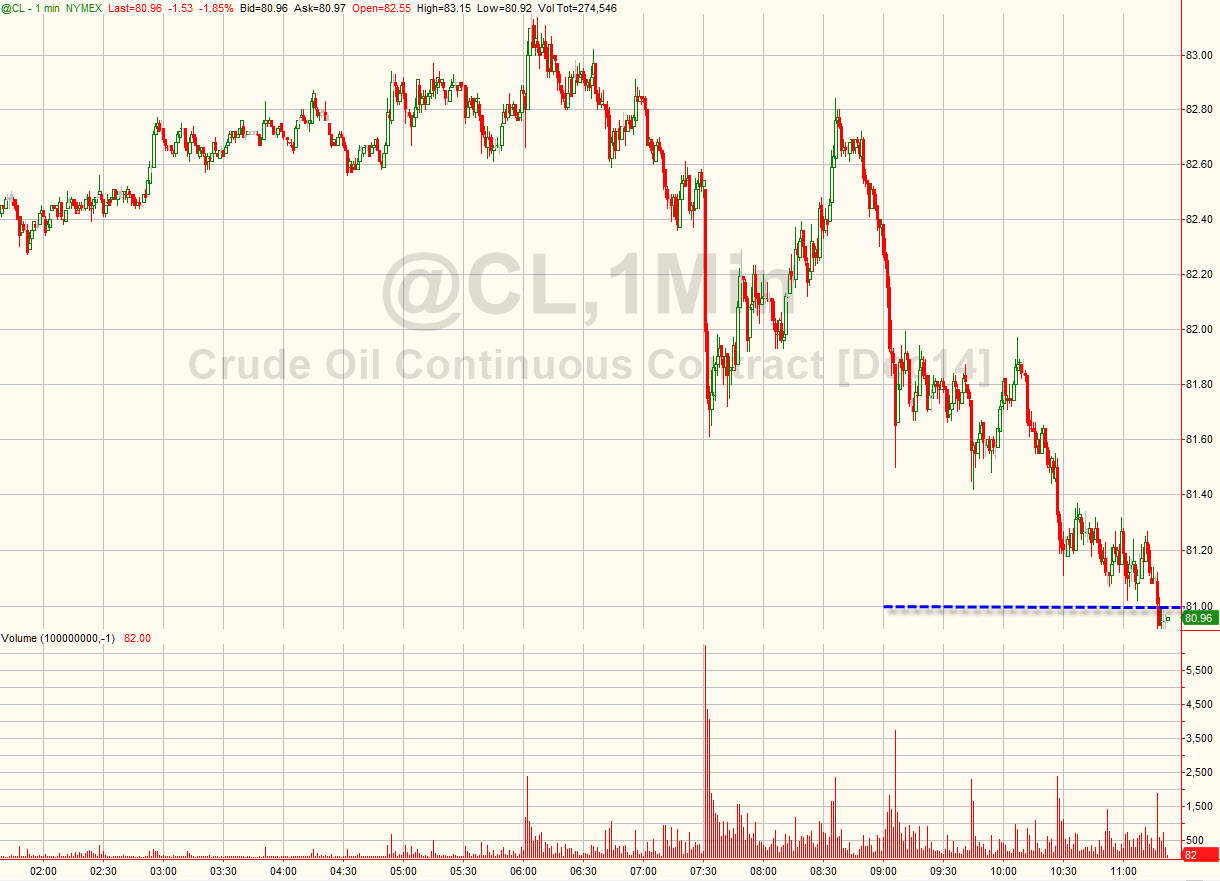
Why it matters…
– And The Market Breaks Again… (ZeroHedge, Oct 17, 2014)
– A Stunned Wall Street Reacts To Today’s Epic Move (ZeroHedge, Oct 15, 2014):
The first report summarizing today’s stunning market action comes from FBN’s Jeremy Klein, who is out with this blurb:
In the first 15 minutes of trading the S&P 500 E-Minis traded below the S&P 500 cash index despite a fair basis, according to Bloomberg, of -6.72. This is unheard of and something I have never witnessed in my near fourteen year career on the Street. I can only conclude that many large institutions threw in the towel on the Open in wake of the dislocations in not only stocks but also treasuries.

– Did Today’s “Satan Signal” In S&P Futures Give The ‘All-Clear’ For Selling To Begin? (ZeroHedge, Oct 9, 2014):
Even Bob Pisani knows by now that the European Close seems to create a trend-reversal moment intraday that few machines (and even fewer humans) are willing to fight. Whether this is remnants of short-term cycles found due to POMO or just a drop in liquidity is unclear; but what is clear, it happens, and all too regularly… except today. After a notably weak start to the day, the machines were just getting revved up for the 1130ET reversal to kick in and lift the market back to VWAP when a curious thing happened… “someone” canceled-and-replaced orders for 666 contracts 26 times in the 1130ET to 1200ET period… and selling accelerated lower, no reversal, to close at the lows on heavy volume.
…
We are sure this is nothing… just pure coincidence that on the 4th most active trading day in history and on following a huge surge day in stocks not trusted by any other asset class, someone would send 26 separate times in a few minutes orders for 666 contracts.
Only a tin-foil-hat-wearing digital dickweed would see anything odd about that: for everyone else this is merely yet another market anomaly that is best left unmentioned.
Read moreDid Today’s ‘Satan Signal’ In S&P Futures Give The ‘All-Clear’ For Selling To Begin?
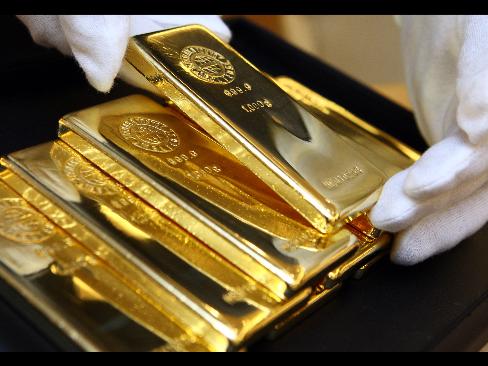
– The Dow And S&P 500 Soar To Irrational Heights While The Ultra-Wealthy Rush To Buy Gold Bars (Economic Collapse, Sep 18, 2014):
Did you know that the number of gold bars being purchased by ultra-wealthy individuals has increased by 243 percent so far this year? If stocks are just going to keep soaring, why are they doing this? On Thursday, the Dow Jones industrial average and the S&P 500 both closed at record highs once again. It is a party that never seems to end, and there are a lot of really happy people on Wall Street these days. But those that are discerning realize that we witnessed the exact same kind of bubble behavior during the dotcom boom and during the run up to the last financial crash in 2007. The irrational exuberance that we are witnessing right now cannot go on forever. And the bigger that this bubble gets, the more painful that it is going to be when it finally bursts. Those that get out at the peaks of the market are the ones that usually end up making lots of money. Those that ride stocks all the way up and all the way down are the ones that usually end up getting totally wiped out.


