LIES, DAMNED LIES & STATISTICS

LIES, DAMNED LIES & STATISTICS (Washington’s Blog, July 19, 2015):

The government released their monthly CPI report this week. Even though it came in at an annualized rate of 3.6%, they and their mouthpieces in the corporate mainstream media dutifully downplayed the uptrend. They can’t let the plebs know the truth. That might upend their economic recovery storyline and put a crimp into their artificial free money, zero interest rate, stock market rally. If they were to admit inflation is rising, the Fed would be forced to raise rates. That is unacceptable in our rigged .01% economy. There are banker bonuses, CEO stock options, corporate stock buyback earnings per share goals and captured politician elections at stake.

The corporate MSM immediately shifted the focus to the annual CPI figure of 0.1%. That’s right. Your government keepers expect you to believe the prices you pay to live your everyday life have been essentially flat in the last year. Anyone who lives in the real world, not the BLS Bizarro world of models, seasonal adjustments, hedonic adjustments, and substitution adjustments, knows this is a lie. The original concept of CPI was to measure the true cost of maintaining a constant standard of living. It should reflect your true inflation of out of pocket costs to live a daily existence in this country.

Read moreLIES, DAMNED LIES & STATISTICS

John Williams’ Take On The October Unemployment Report: “The Economy Remains In Terrible Shape”

John Williams’ Take On The October Unemployment Report: “The Economy Remains In Terrible Shape” (ZeroHedge, Nov 10, 2014):

When it comes to inflation data, there are two parallel sources: the BLS, and ShadowStats’ John Williams, who continues to plough through the underlying “data” using pre-pre-pre-revision protocols, and every month reveals a parallel universe in which something shocking is revealed: the truth. Here is his take on the October “weaker but really stronger than expected” jobs numbers. Here is what really happened.

From ShadowStats

Never Recovered, the Economy Remains in Terrible Shape.  The large number of opening headlines in today’s (November 9th) missive reflects various stories, ranging from twisted unemployment data, to an election dominated by underlying economic reality, and to headline 2014 financial results on the federal government’s operations that should raise some troubling questions in the markets.  The general outlook is unchanged

Read moreJohn Williams’ Take On The October Unemployment Report: “The Economy Remains In Terrible Shape”

The Magic Of CPI: Watch How Economists Transform A 400% Price Increase Into A 7.1% Decline

VoodooEconomists-futurama

The Magic Of CPI: Watch How Economists Transform A 400% Price Increase Into A 7.1% Decline (ZeroHedge, Nov 6, 2014):

Confused how your cost of living increase is always orders of magnitude above the “inflation” reported by the BLS’ Consumer Price Index? Then prepare for your daily dose of Keynesian epiphany, with this step by step guide from the BLS of how to use the Hedonic Quality Adjustment to turn a 400% price increase into a 7.1% decline.

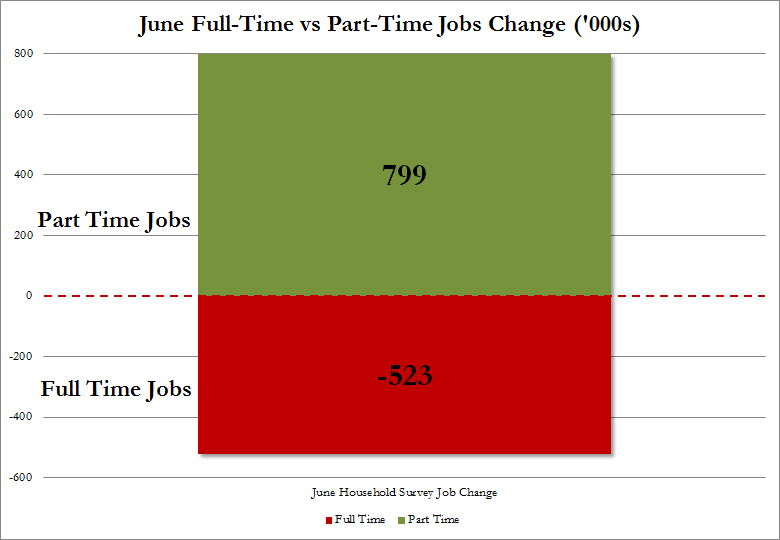
RECOVERY: June Full-Time Jobs Plunge By Over Half A Million, Part-Time Jobs Surge By 800K, Most Since 1993

June Full-Time Jobs Plunge By Over Half A Million, Part-Time Jobs Surge By 800K, Most Since 1993 (ZeroHedge, July 3, 2014):

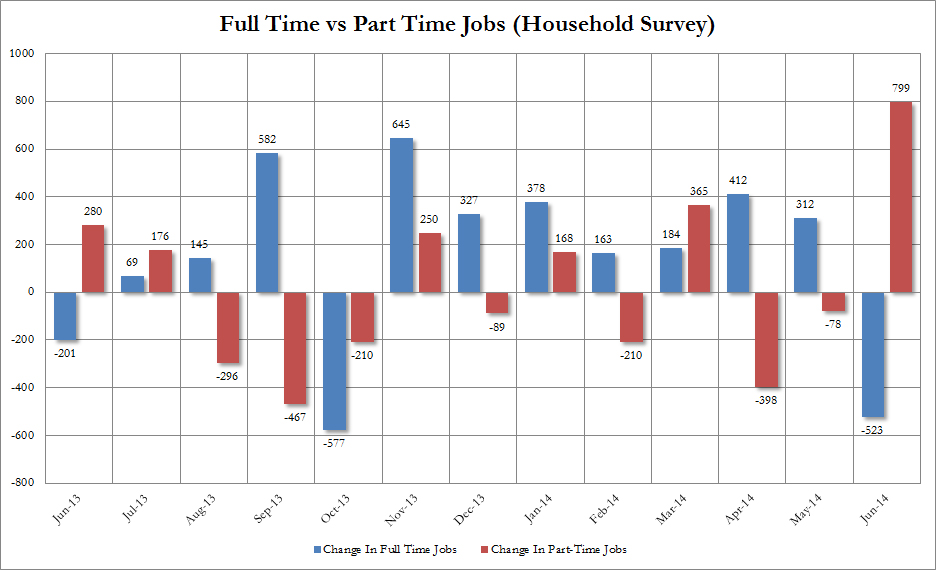
Is this the reason for the blowout, on the surface, payroll number? In June the BLS reports that the number of full-time jobs tumbled by 523K to 118.2 million while part-time jobs soared by 799K to over 28 million!

Full Part Time June

Looking at the breakdown of full and part-time jobs so far in 2014, we find that 926K full-time jobs were added to the US economy. The offset: 646K part-time jobs.

Full Time LTM

Something tells us that the fact that the BLS just reported June part-time jobs rose by just shy of 800,000 the biggest monthly jump since 1993, will hardly get much airplay today. Because remember: when it comes to jobs, it is only the quantity that matters, never the quality.

Read moreRECOVERY: June Full-Time Jobs Plunge By Over Half A Million, Part-Time Jobs Surge By 800K, Most Since 1993

Labor Force (Lack Of) Participation Or ‘We’ll Just Make It Up As We Go Along’ (Chart Of The Day)

Chart Of The Day: Labor Force (Lack Of) Participation Or “We’ll Just Make It Up As We Go Along” (ZeroHedge, Jan 13, 2014):

By now the widely accepted groupthink on the collapsing labor force participation rate, which as we noted last Friday, cratered to a fresh 35 year low of 62.8% which was the main reason for the collapse in the unemployment rate to 6.7% from 7.3% two months ago, is that it was perfectly expected and is largely due to demographics. Sadly this is just another example of goalseeking a real-time variable to “fit” with a narrative of a recovery when in reality there is no recovery for the record 91.8 million Americans who have given up on work entirely and are now out of the labor force.  All of this is well-known. What may not be as well known is that every two years the BLS releases medium-term (10-year) projections for the participation rate. The projections include the demographic composition of the population and the LFP rates of different  demographic groups, among other statistics. And it is here that we see just how “made up” the narrative surrounding the demographic mea culpa truly is.

Read moreLabor Force (Lack Of) Participation Or ‘We’ll Just Make It Up As We Go Along’ (Chart Of The Day)

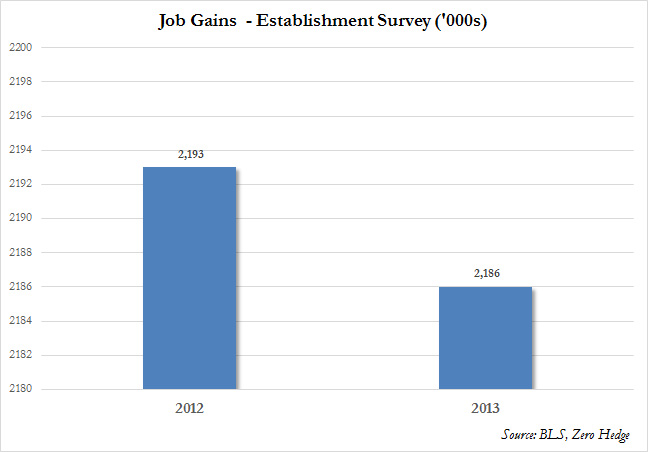
RECOVERY … It’s Official: The US Created Less Jobs In 2013 Than 2012

It’s Official: The US Created Less Jobs In 2013 Than 2012 (ZeroHedge, Jan 10, 2014):

The Fed spent over $1 trillion in 2013 (to push the stock market to all time highs) and all we got was… less jobs created than in 2012?

Establishment survey 2012 vs 2013 job change:

Establishment 2013 vs 2012

And Household survey 2012 vs 2013 job change:

Read moreRECOVERY … It’s Official: The US Created Less Jobs In 2013 Than 2012

Dr. Paul Craig Roberts: More Misleading Official Employment Statistics

Dr. Paul Craig Roberts was Assistant Secretary of the Treasury during President Reagan’s first term. He was Associate Editor of the Wall Street Journal. He has held numerous academic appointments, including the William E. Simon Chair, Center for Strategic and International Studies, Georgetown University, and Senior Research Fellow, Hoover Institution, Stanford University.

More Misleading Official Employment Statistics (Paul Craig Roberts, Dec 10, 2013):

Dear Readers,

Readership has doubled, but donations in response to the current quarterly request are less than when the site had far fewer readers.

Perhaps I have had my 15 minutes of fame and it is time to retire.

Writing these columns does not benefit me. I already know the information that I provide to you, and the establishment has many ways of penalizing a person who doesn’t support the spin.

Remember, this is your site. It will stay up as long as you support it.
PCR

More Misleading Official Employment Statistics

Paul Craig Roberts

The payroll jobs report for November from the Bureau of Labor Statistics says that the US economy created 203,000 jobs in November. As it takes about 130,000 new jobs each month to keep up with population growth, if the payroll report is correct, then most of the new jobs would have been used up keeping the unemployment rate constant for the growth in the population of working age persons, and about 70,000 of the jobs would have slightly reduced the rate of unemployment. Yet, the unemployment rate (U3) fell from 7.3 to 7.0, which is too much for the job gain. It seems that the numbers and the news reports are not conveying correct information.

Read moreDr. Paul Craig Roberts: More Misleading Official Employment Statistics

The Real Unemployment Rate In The U.S. Is At Least 30%

Real Unemployment Rate Is Over 30% (Freedom Outpost, Nov 24, 2013):

What would you say if I told you that the real unemployment rate in America is at least 30%? Would you call me a tin foil hat conspiracy theorist? Hear me out because I can back up that claim if you will give me a few minutes of your time.

The official unemployment number for last month was 7.3%. A lot of Americans don’t understand how this number is calculated and it is very misleading.

The Bureau of Labor Statistics tracks six official unemployment rates as follows:

  • U-1 Persons unemployed 15 weeks or longer, as a percent of the civilian labor force
  • U-2 Job losers and persons who completed temporary jobs, as a percent of the civilian labor force
  • U-3 Total unemployed, as a percent of the civilian labor force (official unemployment rate)
  • U-4 Total unemployed plus discouraged workers, as a percent of the civilian labor force plus discouraged workers
  • U-5 Total unemployed, plus discouraged workers, plus all other persons marginally attached to the labor force, as a percent of the civilian labor force plus all persons marginally attached to the labor force
  • U-6 Total unemployed, plus all persons marginally attached to the labor force, plus total employed part time for economic reasons, as a percent of the civilian labor force plus all persons marginally attached to the labor force

(Source: Bureau of Labor Statistics)

When we speak of a 7.3% official unemployment rate for October of 2013 those numbers are based on U-3. The U-6 number was dramatically higher at 13.8%. Those are not my numbers. That number comes directly from the Bureau of Labor Statistics.

The government doesn’t want to use this 13.8% number because they are afraid how the American people might react.

But what if I told you that the 13.8% number is still way too low? I am not even referencing any Census Bureau cheaters. I am telling you that these numbers are skewed whether Census workers are fudging numbers or not.

I want to show you a chart and I want you to soak it in as much as possible. Take your time because this is something your government will not tell you. The chart is from June but the numbers are pretty close to where they are today.

Read moreThe Real Unemployment Rate In The U.S. Is At Least 30%

Chart Of The Day: America’s Geriatric Work F(a)rce

Chart Of The Day: America’s Geriatric Work F(a)rce (ZeroHedge, Nov 1, 2012):

The traditional excuse apologists for America’s collapsing labor force participation rate use every month is that due to “demographics” and retiring baby boomers, increasingly more old workers are no longer counted by the BLS and as a result, are skewing the labor force. That’s where they leave it because digging into details is not really anyone’s forte anymore. This would be great if it was true. It isn’t.

A month ago in “55 And Under? No Job For You” we presented visually and quite simply that of the 3.3 million jobs “created” (updated for October’s data), a gasp-inducing 3.8 million has gone to workers aged 55 and over, or the one cohort that according to conventional wisdom is retiring, and actively leaving the workforce. How can America’s elderly workers account for more than the total? Simple: workers in the young (16-19) and prime (25-54) cohorts have cumulatively lost a whopping 1.3 million, with just the 25-54 age group losing 842,000 jobs (don’t believe us: spot check it right here courtesy of the Fed).

In other words, America’s edlerly are not only not in a rush to retire, they are reentering the workforce (thanks to the Chairman’s genocidal savings policy which has just rendered the value of all future deposits worthless thanks to ZIRP), and in doing so preventing younger workers, in their prime years, from generating incremental jobs.

Read moreChart Of The Day: America’s Geriatric Work F(a)rce

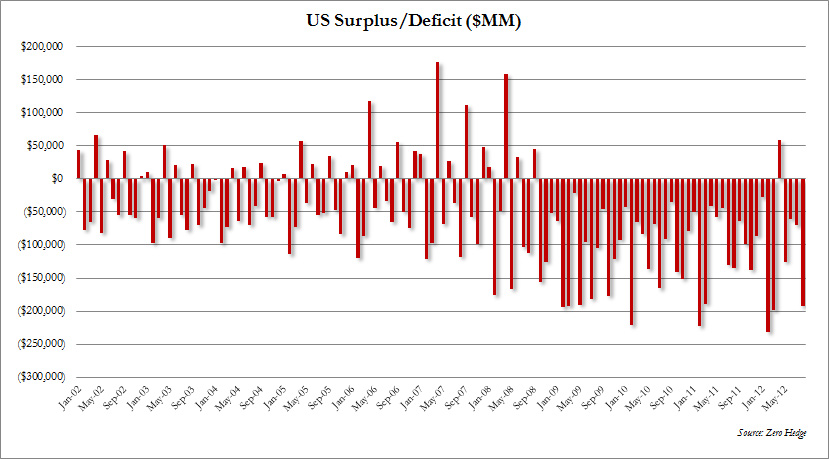
US August Budget Deficit Soars To $192 Billion, $1.17 Trillion In Fiscal 2012

US August Budget Deficit Soars To $192 Billion, $1.17 Trillion In Fiscal 2012 (ZeroHedge, Sep 10, 2012):

While the official number from the FMS is not out yet, according to an advance look by the CBO, the August deficit soared from a modest $70 billion to a whopping $192 billion, the highest August deficit in history, and coming at a time when traditionally the US Treasury does not generate substantial deficits. It also means that “that” $59 billion budget surplus in April, coming after 42 straight months of deficits, and which surprised so many, was just as we suspected, nothing but a play on the temporal mismatch between treasury receipts and outlays. Most importantly, with one month left in the fiscal year, a month which, too, will likely come well above last year’s $63 billion, the US has now spent $1.165 trillion more than it has received via various taxes. Finally so much for the year over year improvement: at $1.23 trillion deficit in the LTM period, this is only 3.2% less than the August 2011 LTM deficit which was $1.27 trillion, despite nearly 2 million more workers employed (at least according to the BLS) and generating tax revenue. Expect the US to end Fiscal 2012 with a total deficit of well over $1.2 trillion, which in turn means that the average burn rate of $100 billion in new debt issuance each month, will continue into the indefinite future.

As a reminder…

Real Unemployment Rate Hits 11.7% As Spread Between Reported And Propaganda Data Hits Record

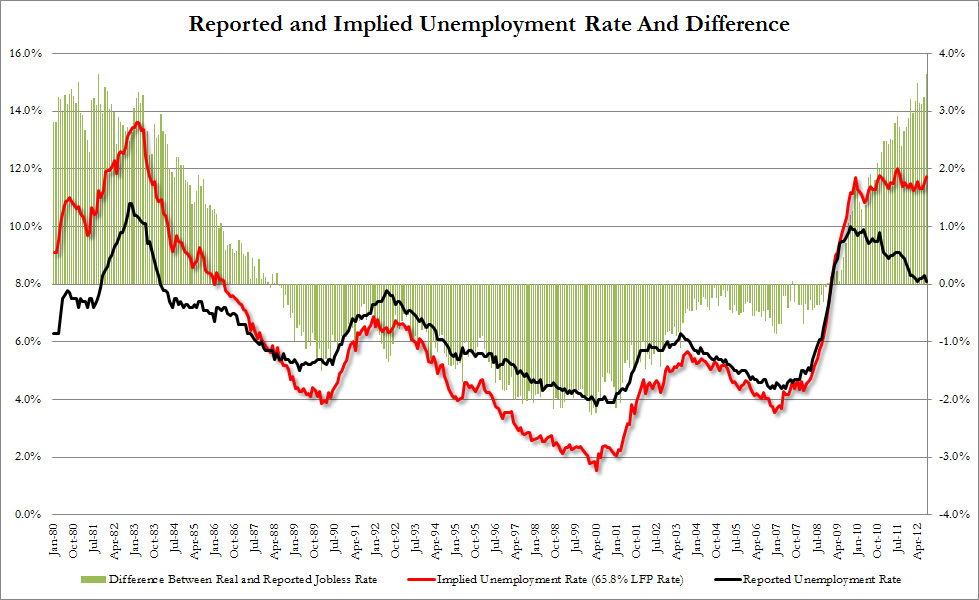
Real Unemployment Rate Hits 11.7% As Spread Between Reported And Propaganda Data Hits Record (ZeroHedge, Sep 7, 2012):

Today’s reported unemployment rate: 8.1%. The reason: the labor “participation” dropped to a 31 year low 63.5% as reported earlier. Of course, this number is pure propaganda, and makes no sense for one simple reason: despite the economic collapse started in December 2007, the US civilian non-institutional population since then has grown by 186,000 people every month on average hitting an all time high of 243,566,000 in August. These people need a job, and the traditional shorthand is that at least 100,000 jobs have the be generated every month for the unemployment rate to merely stay flat, let along improve. So what does one get when one uses the long-term average of the past 30 or so years which happens to be 65.8%? One gets an unemployment number that is 45% higher than the reported 8.1%, or 11.7%. That is what the real unemployment rate is assuming the US labor participation rate was realistic and not manipulated by the BLS cronies and the Bank of Spain assisted Arima-X-13 seasonal adjustment models. It also means that, as the chart below shows, the spread between the real and propaganda data hit an all time record, which was to be expected two months ahead of America’s banker muppet presidential election.

46.5 Million Americans, Record 22.3 Million US Households, On Foodstamps – 8,753,935 On Disability

46.5 Million Americans, Record 22.3 Million US Households, On Foodstamps; 8,753,935 On Disability (ZeroHedge, July 27, 2012):

America’s transition into a welfare state continues, as May saw a new all time high number of American households, 22.3 million to be exact, enter technical poverty and collect foodstamps. At the individual level, 46.5 million Americans lived off foodstamps, a 222,157 increase in the month, or nearly three times the number of people who found jobs in June according to the BLS. Next month this too will be a record, as it is currently just 17,367 before the previous all time high set in December of 2011. The good news, and we use the term loosely, is that the average benefit per household rose from all time lows of $275.82 to $276.76. Surely, the bottom is in and just like housing, there is on blue skies ahead.

And before we go, here is the total number of Americans on disbility: 8,753,935.

Combined foodstamp and disability recipients: 55,250,723