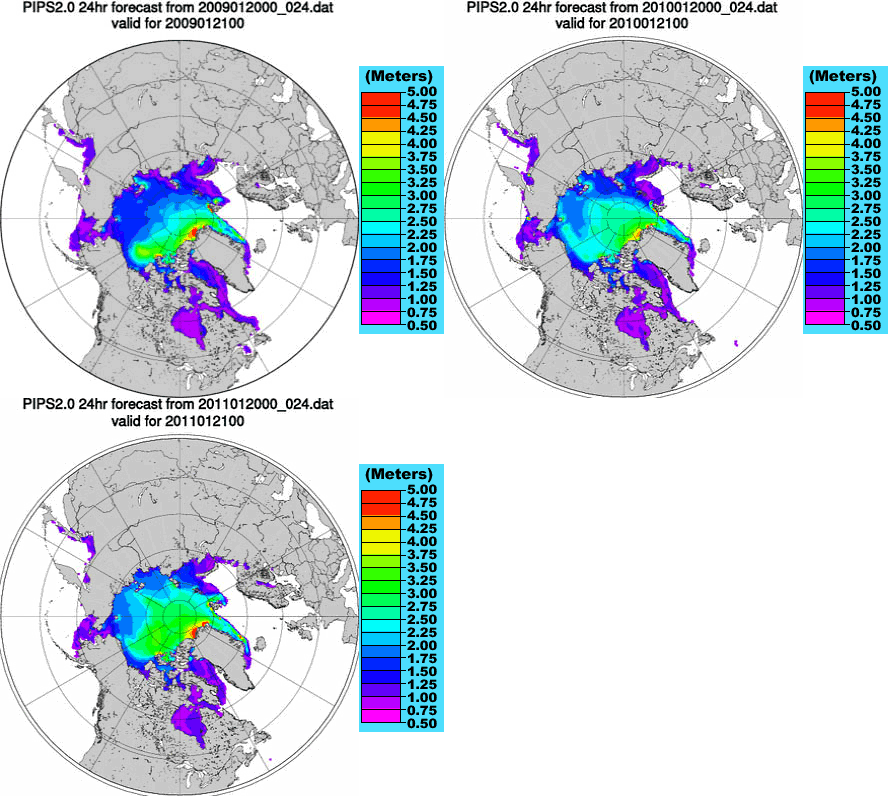
3-transitional images, Jan-2009, Jan-2010, Jan-2011
Comparing imagery of January arctic sea ice from 2009 to 2011 sourced from the U.S. Navy Polar Ice Prediction System, it appears as though the ice sheet has thickened substantially.
That is, the arctic ice during January 2009 compared to January 2010 compared to January 2011, all purposefully compared during the same month of each year.
This observation is looking at ice thickness – not surface area – although some retreat of 1 meter ice can be seen in the Labrador Sea.
Up to 500,000 square miles of the arctic sea region may have thickened from approximately 5 feet thick during January 2009 to approximately 10 feet thick during January 2011.
The ice thickness scale color, dark blue, corresponds to about 1.5 meters, or about 5 feet.
The color green represents about 3 meters, or about 10 feet.
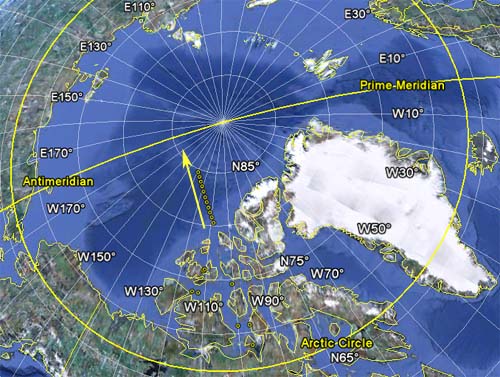
The estimated area that has changed from dark blue to green measures approximately 500,000 square miles based on approximated Google Earth ruler measurements (1,500 miles length by a bit more than 300 miles width, on average – call it 333).
At an increased thickness of 5 feet, that calculates out to be…
500,000 x (5,280 x 5280) x 5 = 69,626,304,000,000
might as well round it to 70,000,000,000,000 cubic feet
It’s getting colder out there!
…which may bring about an entirely new preparedness category
“mini Ice Age”
(actually, we are well within a ‘La Nina’ cycle – cooling of the tropical Pacific Ocean surface)
An interesting ‘coincidence’ is that the magnetic north pole drift direction is nearly the same as the increase in ice sheet depth.
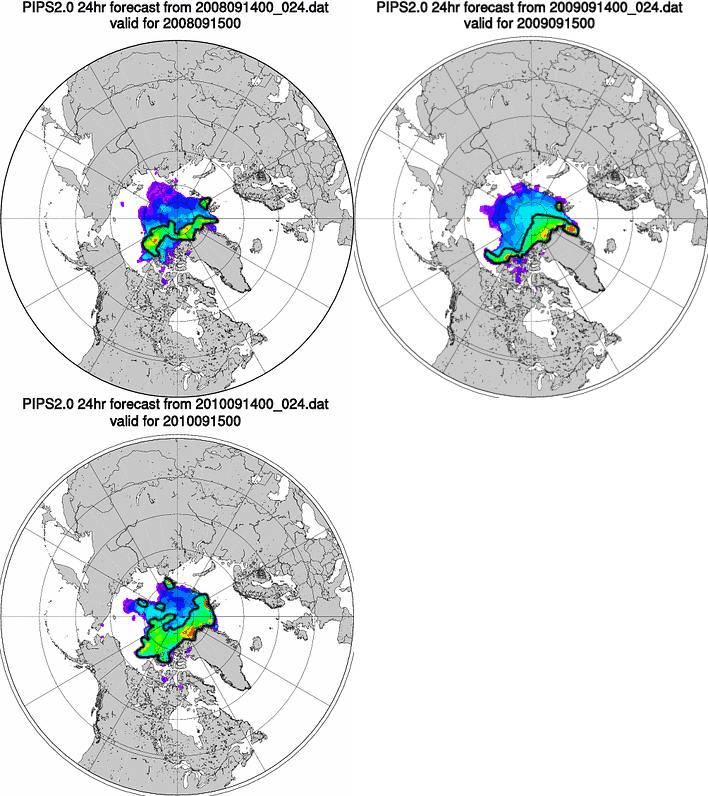
Update, Just for fun, I decided to also capture and loop 3 additional images – one each from Sep-2008, Sep-2009, Sep-2010, to see whether or not a similar apparent increase in ice thickness was visible during that time of year, similar to what is evident while comparing the January ‘winter’ images.
I took the liberty of circling the ‘green’ areas of each image, which represents ice thickness of about 10 feet and greater (3 meters +).
Sep-2008 vs. Sep-2009, looks like the ’09 slide may have a bit more thick ice – pretty close – there’s certainly more ‘light blue’ building up (2 meter ice)
Sep-2009 vs. Sep-2010, looks like the ’10 slide definitely has more of the thick ice
That’s my own interpretation with my eyes though – you be the judge.

3-transitional images, Sep-2008, Sep-2009, Sep-2010
Note: The curiosity to look at recent Arctic ice was born from this winter’s extra cold and precipitation in parts of the northern hemisphere – no attempts are made to calculate the overall sea ice change (globally, or in the entire northern hemisphere) or infer anything prior to 3 years. The January map loop shows slight reduction at southwest Greenland (Labrador Sea), some reduction in Hudson Bay, while some increase at northeast Greenland (Greenland Sea) – possibly an overall neutral effect there. The vast majority of apparent change is in the Arctic Ocean.
Source: Modern Survival Blog


1 thought on “70 Trillion Cubic Feet of NEW ARTIC ICE”