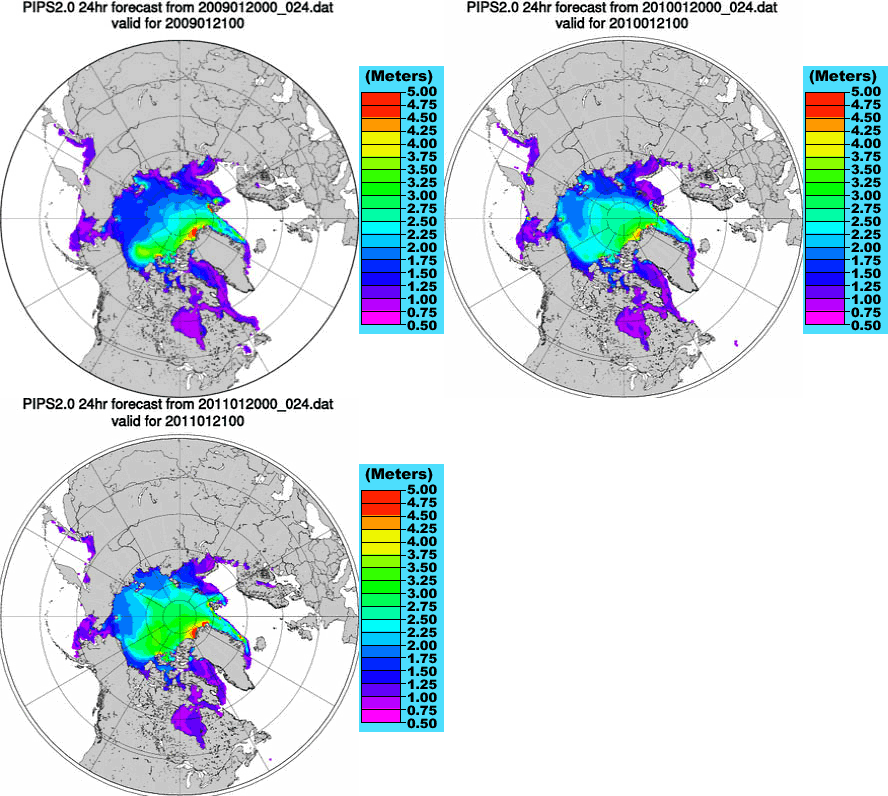
3-transitional images, Jan-2009, Jan-2010, Jan-2011
Comparing imagery of January arctic sea ice from 2009 to 2011 sourced from the U.S. Navy Polar Ice Prediction System, it appears as though the ice sheet has thickened substantially.
That is, the arctic ice during January 2009 compared to January 2010 compared to January 2011, all purposefully compared during the same month of each year.
This observation is looking at ice thickness – not surface area – although some retreat of 1 meter ice can be seen in the Labrador Sea.
Up to 500,000 square miles of the arctic sea region may have thickened from approximately 5 feet thick during January 2009 to approximately 10 feet thick during January 2011.
The ice thickness scale color, dark blue, corresponds to about 1.5 meters, or about 5 feet.
The color green represents about 3 meters, or about 10 feet.
The estimated area that has changed from dark blue to green measures approximately 500,000 square miles based on approximated Google Earth ruler measurements (1,500 miles length by a bit more than 300 miles width, on average – call it 333).
At an increased thickness of 5 feet, that calculates out to be…
500,000 x (5,280 x 5280) x 5 = 69,626,304,000,000
might as well round it to 70,000,000,000,000 cubic feet
It’s getting colder out there!
