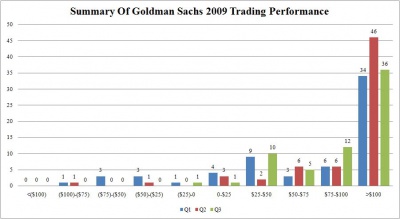
When a firm’s trading performance challenges not only all preconceptions of realistic trading, but also of statistical distributions, one can merely stand back and watch in awe. Attached is a graphic of what a rigged, backstopped and manipulated market is all about.
The chart demonstrates Goldman’s YTD trading track record: out of 194 trading days in 2009, the firm has made over $100 million on 116 occasions! This alone accounts for $11.6 billion in revenue (and is likely much more as Goldman could have easily had a $1 billion trading day in the rightmost bracket as it is open ended).
Assuming midline averages for any given bucket and multiplying by the amount of days that the firm traded within these, Goldman Sachs has made $15 billion courtesy of the skewed and very highly improbable (but not impossible, thank you taxpayers and Ben Bernanke) chart.
(Click on images to enlarge.)

And a more granular read, demonstrates that as the year has progressed, Goldman has become much better at extracting larger wins and minimizing losses. The firm lost money on just 3 days in the last two quarters. Is this a ponzi scheme? We surely don’t know absent additional information (which will never be forthcoming, despite that GS is a public company).
Is this comparable to the returns generated by a ponzi scheme? Absofuckinlutely.

Can the SEC please dissolve itself already and save taxpayers at least a little money?
By Tyler Durden on 11/04/2009
Source: ZeroHedge