Welcome to the recovery!
Prepare for collapse …
– Copper Crashes, In Danger Of Breaching 15-Year Support Level (ZeroHedge, July 6, 2015):
While the PBOC was literally everything in its power to keep the SHCOMP green (it was too late to save the Shenzhen, the Chinext or most Chinese stocks as the PBOC’s firepower was limited to just the largest companies), it forgot about that other proxy of overall Chinese health: copper which, as the chart below shows, plunged by 4% to the lowest price since February when the oil commodity crash left everyone speechless and was threatening to destroy the entire junk bond space.
But while in this centrally-planned world, in which nobody even denies anymore that all markets have become central banker playthings, fundamentals are irrelevant and few have a clue what this latest crash in copper may signify (some do, and it isn’t pretty) an even more disturbing clue for the fate of this erstwhile “market doctor” is revealed when looking at the long-term price chart. Here, as SocGen notes, copper is in danger of breaching a huge 15 year support line… after which it is free fall for a long, long time.
From SocGen
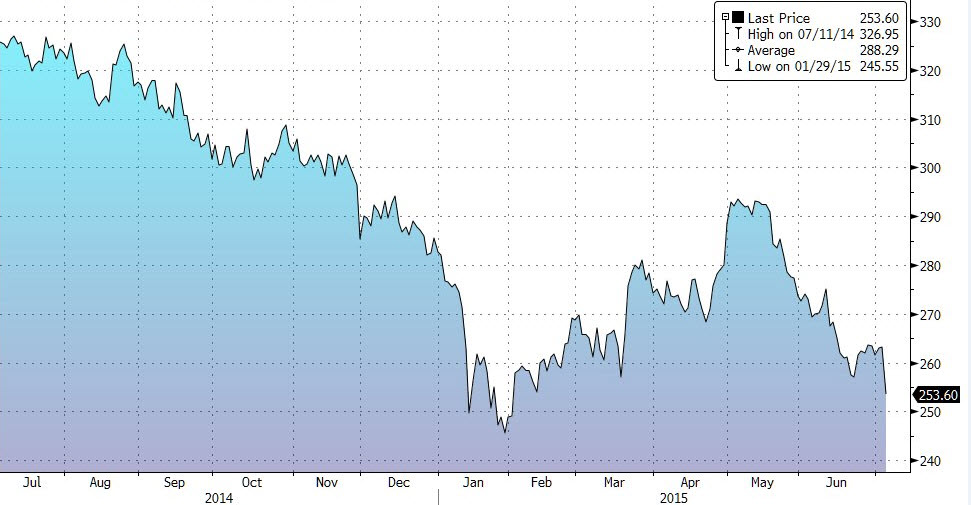
Copper is probing again the 15-year trend line support (5550 levels).
After hitting the multi-year channel upper limit a month ago (now at 6330), Copper has embarked on a steady yet steep downtrend and is now probing again the 15-year trend line (5550 levels, monthly log chart). Copper tested that trend line support during last January sell-off but eventually did not close below on a monthly basis. In the event of a definite close below, the down trend would regain bearish momentum and therefore extend towards 5250/5170 (2007 lows) and possibly even towards the channel support (5000) which has encompassed the down move over the last 2/3 years.
Near term, the down trend in force since early May looks relentless and vivid as underlined by the bearish channel (5710-5460) but, as such, is starting to look overstretched. Daily RSI has indeed achieved a multi-month support (blue line).
Thus, 5550 (excess possible at 5460 intraday) appears to be a key and pivotal support. It will however take a break above the graphic resistance at 5630/40 and more importantly above the channel resistance at 5710 for a meaningful rebound to materialize.

Will the PBOC step in to also rescue this flashing red asset class, or will the last remaining indicator of global economic health (or lack thereof) be left to fend for itself and be the latest confirmation that excluding central bank support of all stocks around the globe, the world is now gripped by an unprecedented economic depression.