– Strontium-90 of #Fukushima Origin Found in 10 Prefectures (Fukushima Diary, July 24, 2012):
Japanese government has started to admit the actual contamination situation because of Fukushima little by little.
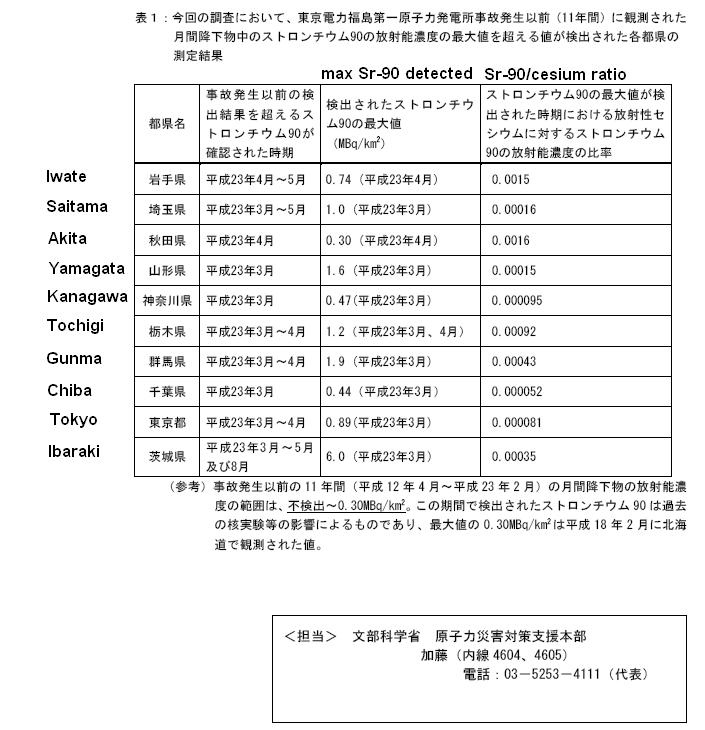
On 7/24/2012, Ministry of Education, Culture, Sports, Science and Technology published the data of strontium90. This measured has been done since before 311 monthly. The published data was taken from 4.2010 to 12.2011.
It’s been reported that strontium90 from Fukushima was measured in Fukushima and Miyagi. This data reported it was measured in 10 other prefectures as well,
Tokyo
Kanagawa
Chiba
Saitama
Tochigi
Gunma
Ibaraki
Yamagata
Iwate
Akita
MEXT states the highest reading was 6 Bq/m2 in Hitachinaka city Ibaraki, which was taken in 3.2011.
It was 1/2850 of cesium supposedly, which is harmless for health.
However, 195 Bq/Kg of strontium90 was detected in Yokohama. (cf. Breaking News: Measurement result of Strontium-90)

Source
It took about 15 to 16 months for the Ministry of Education and Science or MEXT (the very name is a joke at this point) to announce radioactive strontium (Sr-90) was widely dispersed from the broken reactors at Fukushima I Nuclear Power Plant last year in 10 prefectures in Kanto and Tohoku, to the levels last seen in the Chernobyl accident.
Caveat is that it excludes Fukushima and Miyagi, probably the two most contaminated with radioactive fallout from the Fukushima accident. MEXT’s excuse is that the stations in these prefectures have been damaged by the earthquake/tsunami.
From the press release by Ministry of Education and Science on July 24, 2012, “Analysis of Strontium-90 in the monthly environmental radioactivity levels (fallout)” (in Japanese; labels added by me):
Asahi Shinbun has a chart that tries to put these numbers in perspective. The bump this time looks slightly bigger than the one after the Chernobyl accident. But Asahi, either in its scientific illiteracy or on purpose to minimize the latest bump, uses the normal scale on the Y-axis instead of a log scale which would make it easier to discern the fluctuations in smaller numbers:
Looking for a historical chart on a log scale, I went to the site maintained by the Japan Chemical Analysis Center. I searched the database, and the 2011 data is already in the database. Here’s the chart I created using the graph function at the site. I added the thin red line later to compare the 2011 level with that after the Chernobyl accident. It does look it is ever so slightly higher. The chart is a log scale, and the data is from all prefectures:
I wonder what the levels would be if Fukushima and Miyagi’s data were to be added. Back to the level during the atmospheric nuclear testing? Or would it exceed that level?
