The $23 Trillion Credit Bubble In China Is Starting To Collapse – Global Financial Crisis Next?

The $23 Trillion Credit Bubble In China Is Starting To Collapse – Global Financial Crisis Next? (Economic Collapse, Jan 20, 2014):

Did you know that financial institutions all over the world are warning that we could see a “mega default” on a very prominent high-yield investment product in China on January 31st?  We are being told that this could lead to a cascading collapse of the shadow banking system in China which could potentially result in “sky-high interest rates” and “a precipitous plunge in credit“.  In other words, it could be a “Lehman Brothers moment” for Asia.  And since the global financial system is more interconnected today than ever before, that would be very bad news for the United States as well.  Since Lehman Brothers collapsed in 2008, the level of private domestic credit in China has risen from $9 trillion to an astounding $23 trillion.  That is an increase of $14 trillion in just a little bit more than 5 years.  Much of that “hot money” has flowed into stocks, bonds and real estate in the United States.  So what do you think is going to happen when that bubble collapses?

Read moreThe $23 Trillion Credit Bubble In China Is Starting To Collapse – Global Financial Crisis Next?

The Biggest Banking Disconnect Since Lehman Hits A New Record

–  The Biggest Banking Disconnect Since Lehman Hits A New Record (ZeroHedge, Oct 10, 2013):

As regular readers know, the biggest (and most important) disconnect in the US banking system is the divergence between commercial bank loans, which most recently amounted to $7.32 trillion, a decrease of $9 billion for the week, and are at the same the same level when Lehman filed for bankruptcy having not grown at all in all of 2013 (blue line below), and their conventionally matched liability: deposits, which increased by $60 billion in the past week to $9.63 trillion, an all time high. The spread between these two key monetary components – at least in a non-centrally planned world – which also happen to determine the velocity of money in circulation (as traditionally it is private banks that create money not the Fed as a result of loan demand) is now at a record $2.3 trillion.

Which, of course, also happens to be the amount of reserves the Fed has injected into the system (i.e., how much the Fed’s balance sheet has expanded) since the great experiment to bailout the US financial system started in September 2008, in which Ben Bernanke, and soon Janet Yellen, stepped in as the sole source of credit money. The only difference is that while the Fed is actively pumping bank deposits courtesy of the fungibility of reserves, loan are unchanged.

For those who still don’t understand the identity between Fed reserves and bank deposits, here is Manmohan Singh with the simplest explanation on the topic:

Read moreThe Biggest Banking Disconnect Since Lehman Hits A New Record

The Fed Is Paying Banks NOT To Lend 1.8 Trillion Dollars To The American People

The Federal Reserve Is Paying Banks NOT To Lend 1.8 Trillion Dollars To The American People (Economic Collapse, July 1, 2013):

Did you know that U.S. banks have more than 1.8 trillion dollars parked at the Federal Reserve and that the Fed is actually paying them not to lend that money to us?  We were always told that the goal of quantitative easing was to “help the economy”, but the truth is that the vast majority of the money that the Fed has created through quantitative easing has not even gotten into the system.  Instead, most of it is sitting at the Fed slowly earning interest for the bankers.  Back in October 2008, just as the last financial crisis was starting, Federal Reserve Chairman Ben Bernanke announced that the Federal Reserve would start paying interest on the reserves that banks keep at the Fed.  This caused an absolute explosion in the size of these reserves.  Back in 2008, U.S. banks had less than 2 billion dollars of excess reserves parked at the Fed.  Today, they have more than 1.8 trillion.  In less than five years, the pile of excess reserves has gotten nearly 1,000 times larger.  This is utter insanity, and it will have very serious consequences down the road.

Posted below is a chart that shows the explosive growth of these excess reserves in recent years…

Read moreThe Fed Is Paying Banks NOT To Lend 1.8 Trillion Dollars To The American People

The Bill Clinton Myth

The Bill Clinton Myth (ZeroHedge, Sep 9, 2012):

Earlier this week, former U.S. president Bill Clinton gave the keynote address to the Democractic National Convention in an effort to lend some of his popularity to Barack Obama.  With the unemployment rate still stubbornly high at 8.1%, Obama has lost many of the enthused voters who put him into the Oval Office in 2008.  Clinton was tapped to deliver the speech not only because of his image of a wonkish pragmatist but because of his presiding over the booming economy of the late 1990s.  Like a prized mule, Clinton was dragged out to give Democrats someone to point to and say that his policies were the hallmark of smart governance.

Read moreThe Bill Clinton Myth

As M2 Money Supply Rolls Over, The Stock Market Will Follow

As M2 Money Supply Rolls Over, the Stock Market Will Follow (ZeroHedge, July 11, 2012):

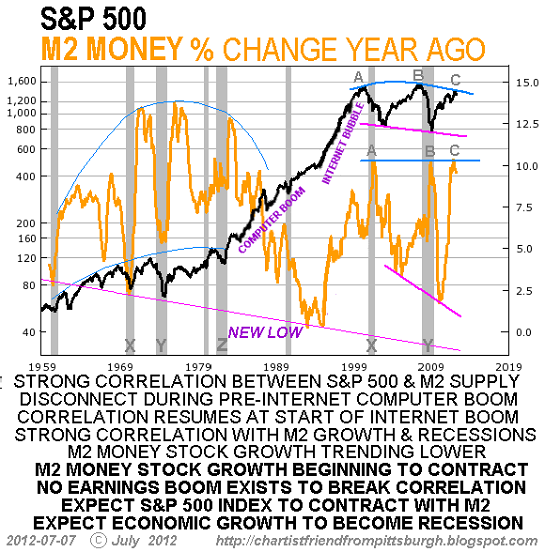
M2 money supply rose sharply, driving the stock market higher. Now it has peaked and rolled over. That does not bode well for the Bull market.

Our Chartist Friend from Pittsburgh kindly shared a chart of M2 money supply and the S&P 500 stock market index (SPX). The correlation between expansion of the money supply and the stock market is worth studying.

The primary point is that “real growth,” i.e. rising wages and profits powered by increases in productivity, does not require massive growth of M2.

Here is Chartist Friend from Pittsburgh’s explanatory commentary:

“He who controls the money supply of a nation controls the nation.” President James A. Garfield

Except during periods of exceptional earnings growth like we had during the pre-internet computer boom when companies like Microsoft, Oracle and Intel were improving business productivity by leaps and bounds, the trend of the stock market (and economic growth in general) tends to closely follow changes in Fed controlled money supply growth.

Read moreAs M2 Money Supply Rolls Over, The Stock Market Will Follow

Federal Reserve’s Record Setting Money Supply Splurge Spurs Gold’s Rally

Fed’s Record Setting Money Supply Splurge Spurs Gold’s Rally (ZeroHedge, Feb. 7, 2012):


Fed’s Record Setting Money Supply Splurge Spurs Gold’s Rally

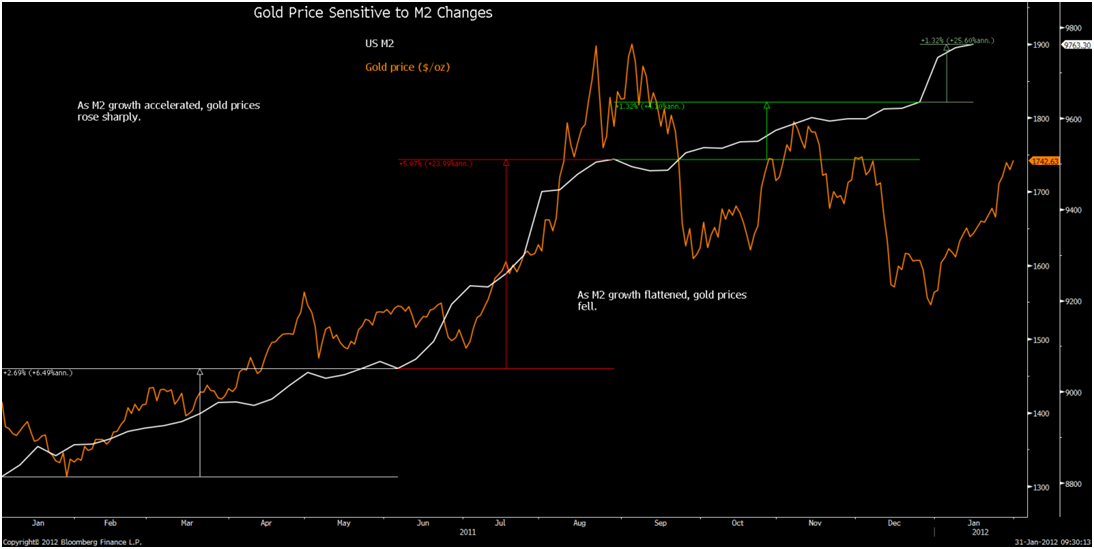
The surge in the U.S. money supply in recent years has sent gold into a series of new record nominal highs.

Money supply surged again in 2011 sending gold to new record nominal highs.

Money supply has grown again, by more than 35% on an annualized basis, and this is contributing to gold’s consolidation and strong gains in January.

The Federal Reserve’s latest weekly money supply report from last Thursday shows seasonally adjusted M1 rose $13.2 billion to $2.233 trillion, while M2 rose $4.5 billion to $9.768 trillion.

Jim Rogers: QE NEVER STOPPED – The Fed Is Lying About QE 3 – Rising Money Supply Proves There Is QE 3 – On MF Global (Video)


YouTube Added: 22.11.2011

Rising unemployment and a failing economy in the U.S.

Current Numbers Dont Add Up To Recovery

torn-dollar

This past week the BLS (Bureau of Labor Statistics) released the September unemployment statistics and they worsened as usual, as America enjoys its recovery.

U-1-Those unemployed 15 weeks or longer, as a percent of the civilian labor force was 5.4%.

U-2-Job losers and persons who completed temporary jobs, as a percent of the labor force was 6.8%.

U-3-Total unemployed, as a percentage of the civilian labor force, the official unemployment rate, 9.8%.

U-4-Discouraged workers 10.2%.

U-5-Total unemployed plus discharged workers, plus marginally attached workers 11.1%.

U-6-Total unemployed as a percent of the civilian labor force 17%.

If the birth/death ratio is removed, U-6 is in reality 21.3% total US unemployment. The estimate is that 824,000, more jobs may be extracted from the payroll count for the 12-months ended next March. Such a revision would be the biggest since 1991. The BLS is underestimating job losses deliberately and has been for a long time. That would mean September’s loss would be some 300,000 not 263,000.

Such a revision would put job losses not at 4.8 million but 5.6 million jobs.

This is how government has operated for some time and will continue to as long as we allow them too.

Read moreRising unemployment and a failing economy in the U.S.

Federal Reserve is now playing a high-risk game with inflation

The US Federal Reserve is increasing its balance sheet by another $1 trillion, including $300bn of Treasury bonds, the Federal Open Market Committee said on Wednesday.

Yet the pace of US economic decline seems to be slowing, while deflation is nowhere visible. Fed policy is now high-risk, and resurgent inflation may strike sooner than expected.

Read moreFederal Reserve is now playing a high-risk game with inflation