– An Expert That Correctly Called The Last Two Stock Market Crashes Is Now Predicting Another One (Economic Collapse, July 28, 2015):
What I am about to share with you is quite stunning. A well-respected financial expert that correctly predicted the last two stock market crashes is now warning that we are right on the verge of the next one. John Hussman is a former professor of economics and international finance at the University of Michigan, and the information in his latest weekly market comment is staggering. Since 1970, there have only been a handful of times when a combination of market signals that Hussman uses have indicated that a major market peak has been reached. In 1972, 2000 and 2007 each of those peaks was followed by a dramatic stock market crash. Now, for the first time since the last financial crisis, all four of those signals appeared once again during the week of July 17th. If Hussman’s analysis is correct, this could very well mean that the next great stock market crash in the United States is imminent.
It was an excellent article by Jim Quinn of the Burning Platform that first alerted me to Hussman’s latest warning. If you don’t follow Quinn’s work already, you should, because it is excellent.
When someone is repeatedly correct about the financial markets, we should all start paying attention. Back in late 2007, Hussman warned us about what was coming in 2008, but most people did not listen.
Now he is sounding the alarm again. According to Hussman, when there is a confluence of four key market indicators, that tells us that the market has peaked and is in danger of crashing. The following comes from Newsmax…
He cited the metric among the indicators that foreshadowed declines after peaks in 1972, 2000 and 2007:
*Less than 27 percent of investment advisers polled by Investors Intelligence who say they are bearish.
*Valuations measured by the Shiller price-to-earnings ratio are greater than 18 times.
*Less than 60 percent of S&P 500 stocks above their 200-day moving averages.
*Record high on a weekly closing basis.
“The most recent warning was the week ended July 17, 2015,” Hussman said. “It’s often said that they don’t ring a bell at the top, and that’s true in many cycles. But it’s interesting that the same ‘ding’ has been heard at the most extreme peaks among them.”
It is quite rare for the market to set a new record high on a weekly closing basis and have more than 40 percent of stocks below their 200-day moving averages at the same time. That is why a confluence of all these factors is fairly uncommon. Hussman elaborated on this in his recent report…
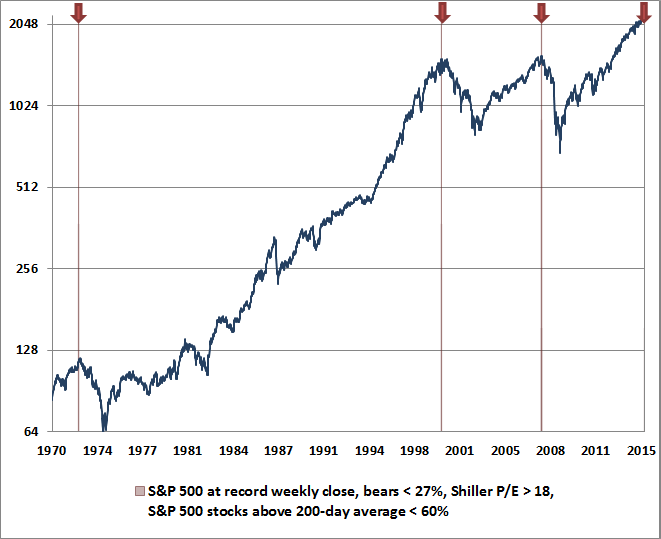
The remaining signals (record high on a weekly closing basis, fewer than 27% bears, Shiller P/E greater than 18, fewer than 60% of S&P 500 stocks above their 200-day average), are shown below. What’s interesting about these warnings is how closely they identified the precise market peak of each cycle. Internal divergences have to be fairly extensive for the S&P 500 to register a fresh overvalued, overbullish new high with more than 40% of its component stocks already falling – it’s evidently a rare indication of a last hurrah. The 1972 warning occurred on November 17, 1972, only 7 weeks and less than 4% from the final high before the market lost half its value. The 2000 warning occurred the week of March 24, 2000, marking the exact weekly high of that bull run. The 2007 instance spanned two consecutive weekly closing highs: October 5 and October 12. The final daily high of the S&P 500 was October 9 – right in between. The most recent warning was the week ended July 17, 2015.
The following is the chart that immediately followed the paragraph in his report that you just read…

When I first took a look at that chart I could hardly believe it.
It appears that Hussman’s signals are able to indicate major stock market crashes with stunning precision.
And considering the fact that we just hit a new “ding” for the first time since the last financial crisis, what Hussman is saying is more than just a little bit ominous.
According to Hussman this is not just a recent phenomenon either. Even though advisory sentiment figures were not available back in 1929, he believes that his indicators would have given a signal that a market crash was imminent in August of that year as well…
Though advisory sentiment figures aren’t available prior to the mid-1960’s, imputed data suggest that additional instances likely include the two consecutive weeks of August 19, 1929 and August 26, 1929. We can infer unfavorable market internals in that instance because we know that cumulative NYSE breadth was declining for months before the 1929 high. The week of the exact market peak would also be included except that stocks closed down that week after registering a final high on September 3, 1929. Another likely instance, based on imputed sentiment data, is the week of November 10, 1961, which was immediately followed by a market swoon into June 1962.
Of course the past is the past, and what has happened in the past will not necessarily happen in the future.
So is Hussman wrong this time? With all of the other things that are happening in the financial world right now, I certainly would not bet against him.
Other financial professionals are concerned that a market crash could be imminent as well. The following comes from a piece authored by Andrew Adams…
More than 13% of stocks on the New York Stock Exchange are at 52-week lows, which is about 6 standard deviations above the average over the last three years (1.62%) and an extreme only seen one other time during said period (last October when the S&P 500 was percentage points away from a 10% correction).
This dichotomy has created what I believe to be the biggest question about the stock market right now – have we already experienced a stealth correction in the majority of stocks that will soon come to an end or will the market leaders finally succumb to the weight of the laggards and join in on the sell-off? The answer to this could end up being worth at least $2.2 trillion, which is how much money would essentially be wiped out of the stock market if we finally get the much-discussed 10% correction in the overall market (the total U.S. stock market capitalization was $22.5 trillion as of June 30, according to the Center for Research in Security Prices).
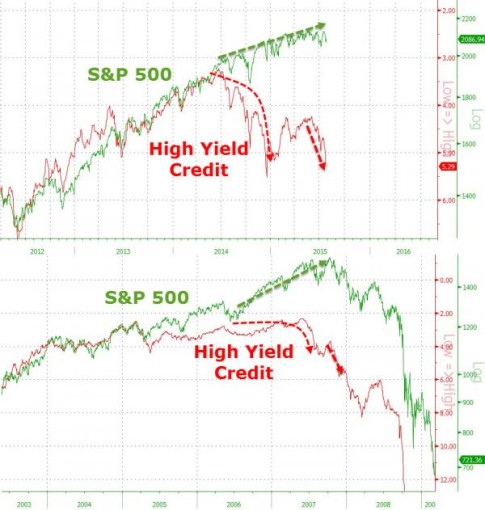
Sometimes, a picture is worth more than a thousand words. I could share many more quotes from the “experts” about why they are concerned about a potential stock market collapse, but instead I want to share with you a “bonus chart” that Zero Hedge posted on Tuesday…

Do you understand what that is saying?
In 2007 and 2008, junk bonds started crashing well before stocks did.
Now, we are witnessing a similar divergence. If a similar pattern holds up this time, stocks have a long, long way to fall.
Like Hussman and so many others, I believe that a stock market crash and a new financial crisis are imminent.
The month of August is usually a slow month in the financial world, so hopefully we can get through it without too much chaos. But once we roll into the months of September and October we will officially be in “the danger zone”.
Keep an eye on China, keep an eye on Europe, and keep listening for serious trouble at “too big to fail” banks all over the planet.
The next several months are going to be extremely significant, and we all need to be getting ready while we still can.


