

– Gold Plummets to 34-Month Lows as Investors Flee (Wall Street Journal, June 26, 2013):
Prices are down about 25% this year, with the bulk of the losses occurring since April. On Wednesday, prices fell below $1,250 a troy ounce for the first time in nearly three years.
– Gold Drops to 34-Month Low as Precious Metals Slide on Fed View (Businessweek, June 26, 2013):
Silver futures fell to the lowest since August 2010.
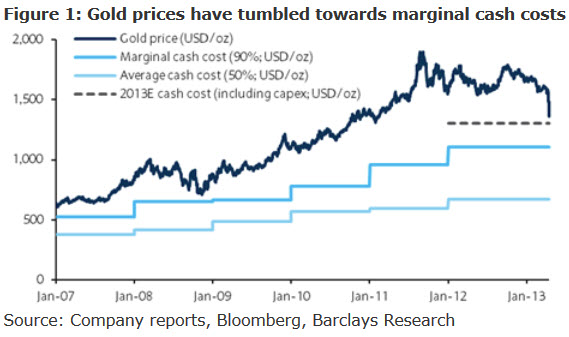
– Gold Drops Below Its Average Cash Cost (ZeroHedge, June 26, 2013):
As shown two months ago, the marginal cost of production of gold (90% percentile) in 2013 was estimated at $1300 including capex. Which means that as of a few days ago, gold is now trading well below not only the cash cost, but is rapidly approaching the marginal cash cost of $1104…

Which means that of the following mines (as we showed here) which make up the gold cost curve, one by one, starting on the right and going left, production is going to go dark, even without the recent demand by South African gold miner labor unions to have their wages doubled. Until eventually virtually no gold will be produced.

It is at that point where one must apply the New Normal supply and demand curve, when one can predict a $0 per ounce price for gold, as physical demand continues unabated, while actual physical, not paper, production has now started going offline.
Joking aside, not even Bernanke and all the paper Gold ETFs in the world will be able to do much to suppress gold prices from reaching their fair value when gold production hits a standstill, and when demands, especially by China, is still in the hundreds of tons each year.