Commentary by Jim Stone:
Global warming scam imploding . . .
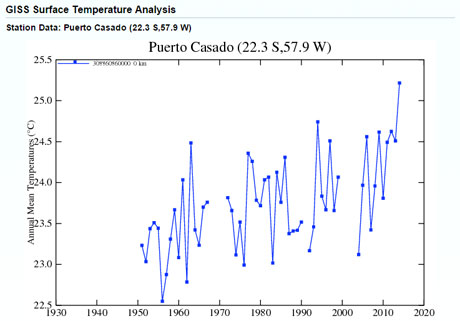
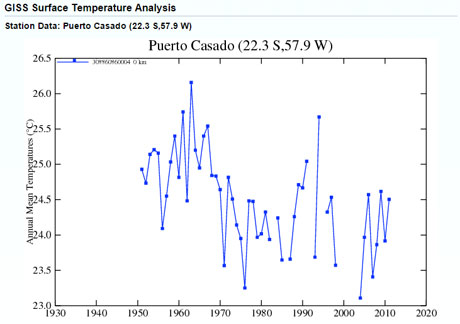
The following graphs are not from a single ground station, they are from a satellite relay station in Puerto Casado, where satellites relayed composite global data back to Earth (for the later portion of the graphs). The left of the graph has the average global temperature in degrees celsius.
This is what Al Dork tried to push:
And this is what really happened:
Both graphs quoted the same data. However, the top graph is a lie, which intentionally misrepresented the data. You were not delusional. It really has been cold.

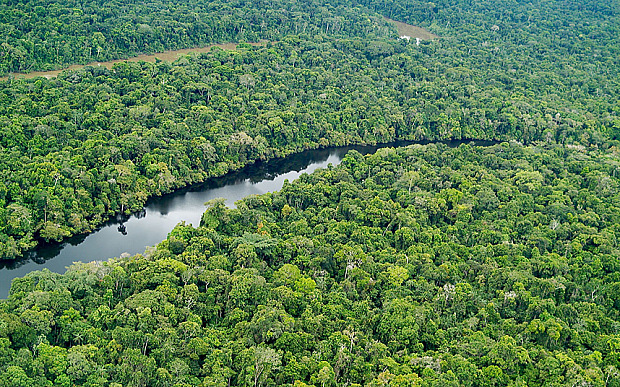
The Yavari Valley rainforest, Peru
– Top scientists start to examine fiddled global warming figures (Telegraph, April 25, 2015):
The Global Warming Policy Foundation has enlisted an international team of five distinguished scientists to carry out a full inquiry
Last month, we are told, the world enjoyed “its hottest March since records began in 1880”. This year, according to “US government scientists”, already bids to outrank 2014 as “the hottest ever”. The figures from the US National Oceanic and Atmospheric Administration (NOAA) were based, like all the other three official surface temperature records on which the world’s scientists and politicians rely, on data compiled from a network of weather stations by NOAA’s Global Historical Climate Network (GHCN).
But here there is a puzzle. These temperature records are not the only ones with official status. The other two, Remote Sensing Systems (RSS) and the University of Alabama (UAH), are based on a quite different method of measuring temperature data, by satellites. And these, as they have increasingly done in recent years, give a strikingly different picture. Neither shows last month as anything like the hottest March on record, any more than they showed 2014 as “the hottest year ever”.
An adjusted graph from the Goddard Institute for Space Studies
Back in January and February, two items in this column attracted more than 42,000 comments to the Telegraph website from all over the world. The provocative headings given to them were “Climategate the sequel: how we are still being tricked by flawed data on global warming” and “The fiddling with temperature data is the biggest scientific scandal”.
My cue for those pieces was the evidence multiplying from across the world that something very odd has been going on with those official surface temperature records, all of which ultimately rely on data compiled by NOAA’s GHCN. Careful analysts have come up with hundreds of examples of how the original data recorded by 3,000-odd weather stations has been “adjusted”, to exaggerate the degree to which the Earth has actually been warming. Figures from earlier decades have repeatedly been adjusted downwards and more recent data adjusted upwards, to show the Earth having warmed much more dramatically than the original data justified.
So strong is the evidence that all this calls for proper investigation that my articles have now brought a heavyweight response. The Global Warming Policy Foundation (GWPF) has enlisted an international team of five distinguished scientists to carry out a full inquiry into just how far these manipulations of the data may have distorted our picture of what is really happening to global temperatures.
The panel is chaired by Terence Kealey, until recently vice-chancellor of the University of Buckingham. His team, all respected experts in their field with many peer-reviewed papers to their name, includes Dr Peter Chylek, a physicist from the National Los Alamos Laboratory; Richard McNider, an emeritus professor who founded the Atmospheric Sciences Programme at the University of Alabama; Professor Roman Mureika from Canada, an expert in identifying errors in statistical methodology; Professor Roger Pielke Sr, a noted climatologist from the University of Colorado, and Professor William van Wijngaarden, a physicist whose many papers on climatology have included studies in the use of “homogenisation” in data records.
Their inquiry’s central aim will be to establish a comprehensive view of just how far the original data has been “adjusted” by the three main surface records: those published by the Goddard Institute for Space Studies (Giss), the US National Climate Data Center and Hadcrut, that compiled by the East Anglia Climatic Research Unit (Cru), in conjunction with the UK Met Office’s Hadley Centre for Climate Prediction. All of them are run by committed believers in man-made global warming.
Below, the raw data in graph form
For this the GWPF panel is initially inviting input from all those analysts across the world who have already shown their expertise in comparing the originally recorded data with that finally published. In particular, they will be wanting to establish a full and accurate picture of just how much of the published record has been adjusted in a way which gives the impression that temperatures have been rising faster and further than was indicated by the raw measured data.
Already studies based on the US, Australia, New Zealand, the Arctic and South America have suggested that this is far too often the case.
But only when the full picture is in will it be possible to see just how far the scare over global warming has been driven by manipulation of figures accepted as reliable by the politicians who shape our energy policy, and much else besides. If the panel’s findings eventually confirm what we have seen so far, this really will be the “smoking gun”, in a scandal the scale and significance of which for all of us can scarcely be exaggerated.
More details of the Global Warming Policy Foundation’s International Temperature Data Review Project are available on the inquiry panel’s website www.tempdatareview.org
See also:
– Human Contribution To (Non-Existent) Global Warming (In One Chart)


1 thought on “The Global Warming Scam Imploding . . . “Top Scientists Start To Examine Fiddled Global Warming Figures” (Telegraph)”