Charts in movie format:
Click on the chart to enlarge (or better open it in a new tab).
(Refresh your browser to watch the movie again)
Movie shows the scale of the crisis, comparing past banking crises back to 1919 to the current crisis.
Why are the Fed’s lending facilities not working this time as in the past?
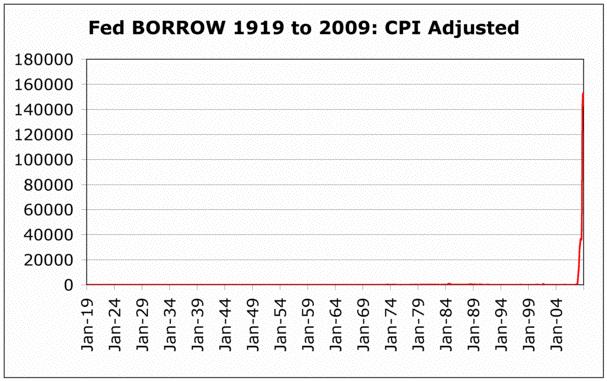
A few readers asked if the BORROW data are CPI adjusted. The answer is, no. We tried it and it just didn’t make that much difference. Our point is this crisis on a different scale than previous crises. Adjusted for CPI does not change that, and you can’t choose an inflation adjustment option to produce a chart from the Fed’s site, and we wanted to use the Fed’s own charts.
Here’s the final chart with the date adjusted for CPI inflation, for the purists
Doesn’t change the story.
Source: itulip

