Related info:
It is colder right now than throughout almost all of history.
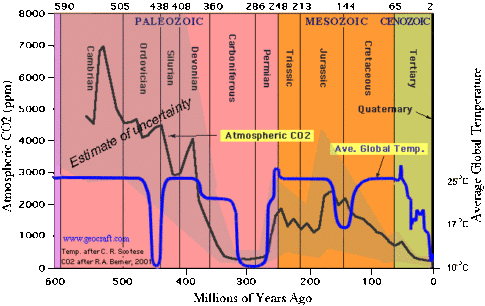
Look at this chart. The blue line shows temperatures for the past 600 million years.
Look at the far right side of the chart (today), and you’ll see that blue line plunge to its lowest point in almost 250 million years.
There have been only two periods in the past 600 million years when it has been colder than today.
https://youtu.be/kcK_TvxbOCI
H/t reader kevin a.
* * *
PayPal: Donate in USD
PayPal: Donate in EUR
PayPal: Donate in GBP

I wanted to comment on this chart last time, but the engine censored my text and even did not show it awaiting for moderation – the links to “politically incorrect” (!) site are not allowed by the automat…
So at least the first part of that text without links to politically incorrect charts…
——-
It is a question, who made this chart and from which sources and methods. (admiting there is link to source, I’m just lazy to go read their work right now)
I doubt it.
I’ve seen other ones, which show more variability of temperature (here you have long flats of constant temperature which seem unreal to me with experience from other charts). Also, levels of CO2 are not possible to know before cca 2 million of years as recorded in antarctic or greenland ice-cores… In your chart, the link and consequence between CO2 and temperature is rather too obvious, although quite long delayed – that which I’ve seen before sometimes showed, that CO2 change follows temperature change and does not precede it… (as solubility of CO2 in ocean water changes with temperature, change of atmospheric CO2 concentration follows sea temperature change…)
Look here for some pre-historic temperature records:
https://en.wikipedia.org/wiki/Geologic_temperature_record
There is also nicely visible, how on one page they can place four completely different historic reconstructions, but still all show that historic temperatures were higher than today…
——-
So why I agree with the “now almost coldest” claim, I disagree with huge “flats” in the chart temperature…
Climate is never so constant, there ALWAYS is a CHANGE…
To P.A. Semi, Agreed.
But even so, extrapolating the graph, most certainly highlights that current levels of CO2 are the lowest for Millions of years.
However, we mustn’t shout too loudly or they’ll change tack and claim it’s a lack of CO2 that will cause it.
https://www.youtube.com/watch?v=FjxR0cnvapA