– It’s Over: San Francisco’s Epic Condo Bubble Bursts:
Done in by a historic construction boom.
Few housing markets are crazier than San Francisco’s. But what had to happen is starting to happen: while house prices continue to soar, a phenomenal building boom is causing a condo glut that will reach dizzying proportions as new condo towers are completed. And now the dynamics of the market have reversed.
The median condo price — half sell for more, half sell for less – was $1,100,000 in the first quarter for sales reported to Multiple Listing Services (MLS) by April 5, according to Paragon Real Estate Group. Up 70% from the first quarter in 2012. But it’s down from $1,107,500 in Q4. Very unusual: the last time the median price did not jump from Q4 to Q1 was in Q1 2012, at the end of the last downturn. For example, over the same period a year ago, condo prices jumped 8.5%!
While this left condo prices up 1.8% from a year ago, they’re down 2.3% from their peak in Q2 last year ($1,125,000).
By comparison, the median house price — at $1,135,000, after nearly doubling from Q1 2012 — has not yet shown any weakness: up 5.2% from Q4 (even as condo prices declined!) and up 17% from a year ago! Patrick Carlisle, Chief Market Analyst at Paragon, explains the phenomenon this way:
In the first quarter of 2016, various market segments in the city began to trend in significantly different directions. Houses, especially those below $2 million, are still often selling in a frenzy of bidding: Recent reports of houses selling with 5, 10 or more competing offers are not uncommon, especially in neighborhoods considered more affordable (by San Francisco standards). Demand remains very high, supply remains extremely low, and new house construction is virtually nil.
Condos are a different story. The condo and rental apartment construction boom has reached feverish levels. The SF Planning Department’s Q4 Pipeline Report lists 62,500 units in the pipeline, from “building permit filed” to “under construction.” If completed, they’ll increase the city’s existing housing stock of 382,000 units (houses, condos, coops, and TICs) by over 16% [read… This Will Crush the Insane San Francisco & Silicon Valley Housing Bubble].
And it already boils down to this:
As of early April, the number of condo listings actively for sale in MLS is up over 40% year over year, and that does not include most of the new-construction condo units hitting the market (not listed in MLS).
But it’s murky out there in the jungle of new construction:
These condos often go into contract during the construction phase, long before sales actually close, and access to information during that period is very limited. There can be no doubt that they comprise serious competition to resale condos in the areas they’re being built.
And luxury condos, where much of the new construction is focused, appear to be most affected.
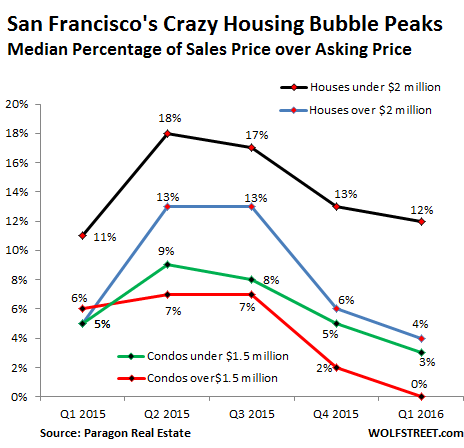
One of the key metrics in determining just how feverish the housing market has become is the median percentage of sales price over asking price. This metric deteriorated sharply for all categories since their respective peaks in Q2 and Q3 last year.
At one end of the spectrum: houses under $2 million (black line in the chart below) still sold for a steamy-hot 12% above asking price. But that’s down from a breath-taking 18% above asking price at the peak in Q2.
At the other end of the spectrum: luxury condos over $1.5 million (red line): the median percentage of sales price over asking price is now 0% (rounded from a “tiny fraction” above asking price). That’s the median. Hence, half the luxury condos sold below asking price!
The chart also shows when the bubble peaked: sometime between Q2 and Q3:
Another tidbit, though not shown in the chart: in areas of San Francisco where the luxury-condo towers are shooting up, according to Paragon, the median percentage of sales price over asking price turned negative, as the median sales price “fell well below” asking price.
As bad as this looks, it does not include the surge of new units that have come on the market because they’re not included in the MLS data. But they will further pressure prices of resale units in future quarters.
Also, today’s sales data reflects the market as it was a month or two ago due to the delay between when units are listed, when offers are negotiated, and when sales are closed. Much of the deterioration linked to the deflating startup boom in Q1 isn’t reflected in today’s data. It will show up in Q2.
Paragon throws some more cold water on it:
Perhaps nothing is more indicative of a cooling market than increasing numbers of listings expiring and being withdrawn from the market without selling. Q1 2016 saw big jumps in expired/withdrawn condo listings over the first quarters of the previous 3 years. Many such listings end up coming back on the market at lower prices.
It’s chilling: for condos under $1.5 million, the number of withdrawn or expired listings soared 94%, and for condos above $1.5 million 128%!
When these unsold units come back on the market, sellers nurturing any hopes of selling their condos will likely have to swallow a bitter pill: reduced asking prices. And this marks the point when the phenomenal, incredible, breath-taking San Francisco condo boom turns into a bust.
The startup boom is floundering. VCs have become skittish. Startups are cutting expenses to stay alive a little longer. IPOs had the worst quarter since 2009, and this has caught the ultimate smart money by surprise. Read… How the Ultimate “Smart Money” Got Stuck in the IPO Pipeline
* * *
PayPal: Donate in USD
PayPal: Donate in EUR
PayPal: Donate in GBP
