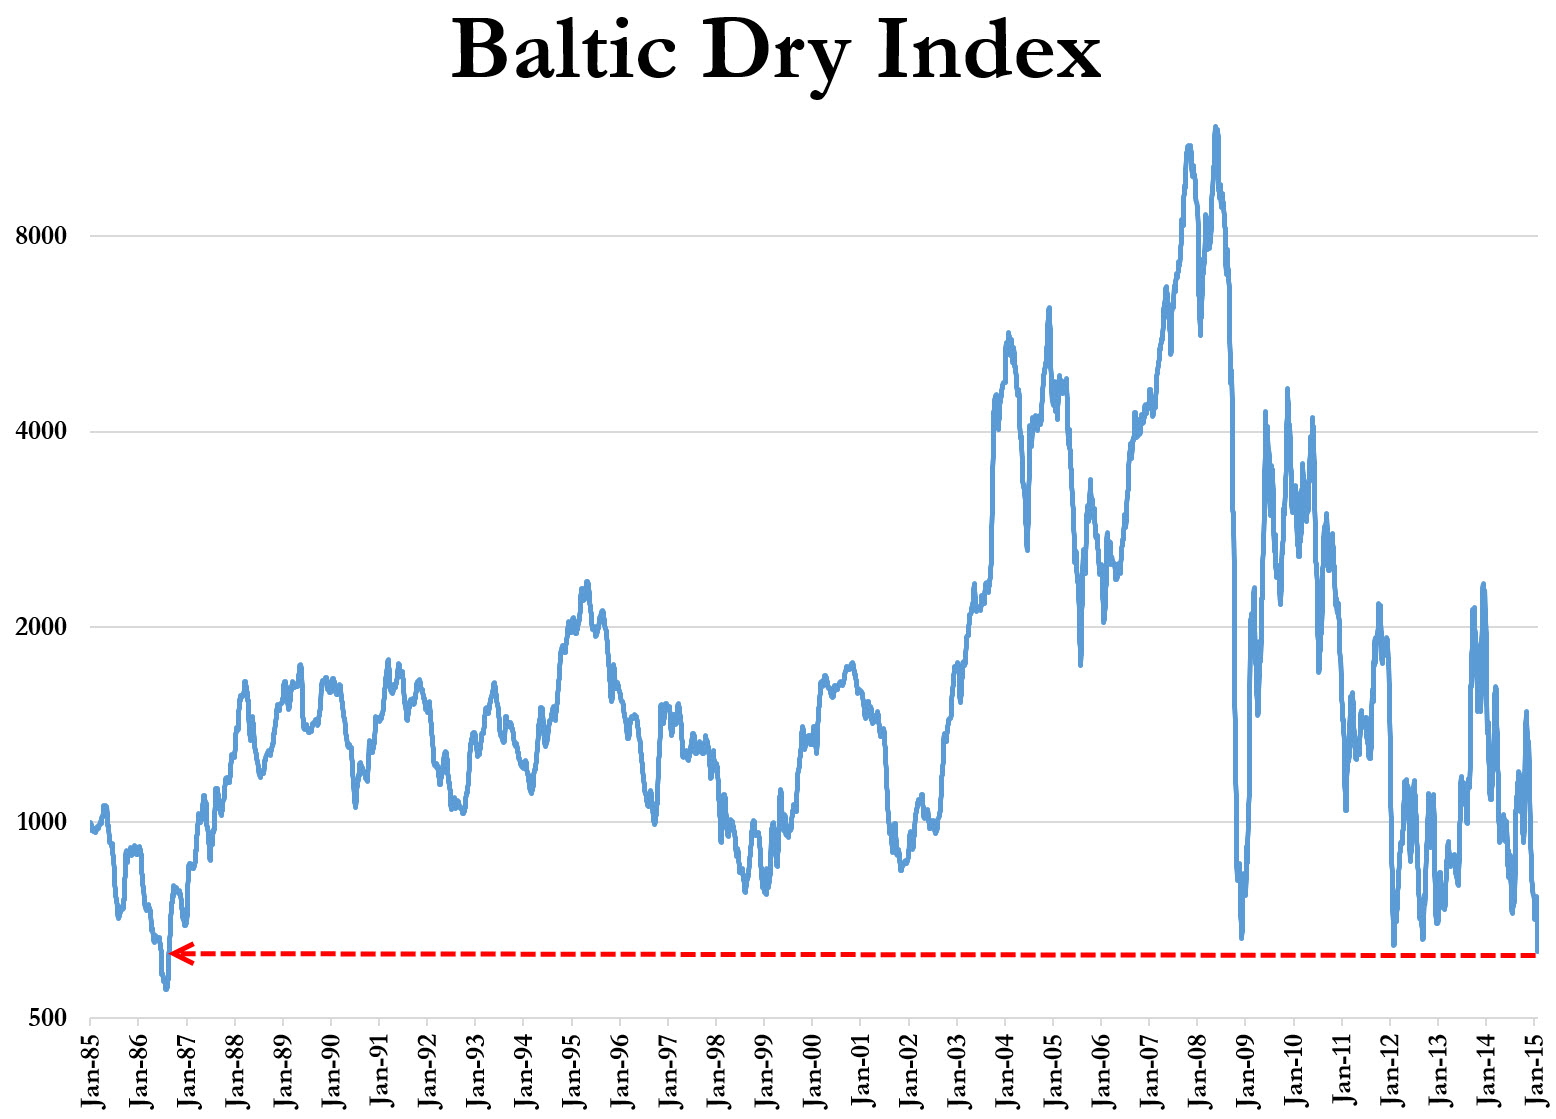
– WTF Chart Of The Day: Baltic Dry Index Crashes To Lowest In 29 Years (ZeroHedge, Jan 29, 2015):
Quietly behind the scenes – and not at all reflective of a collapsing global economy (because that would break the narrative of over-supply and pent-up demand) – The Baltic Dry Index plunged over 5% today to 632… That is the lowest absolute level for the global shipping rates indicator since August 1986…
“Transitory”
Well, first is the lower price of oil and gas, making transportation around the world much less expensive than a year ago.
Next, less people are buying, more are waiting for prices to drop even more…the depression mentality is upon us.
A train wreck? I don’t know about that, I think prices are going down because of all the other factors in the world economy…….perhaps independent traders have a chance. I sure hope so, they provide real jobs.