– How China Imported A Record $70 Billion In Physical Gold Without Sending The Price Of Gold Soaring (ZeroHedge, March 22, 2014):
A little over a month ago, we reported that following a year of record-shattering imports, China finally surpassed India as the world’s largest importer of physical gold. This was hardly a surprise to anyone who has been following our coverage of the ravenous demand for gold out of China, starting in September 2011, and tracing it all the way to the present.
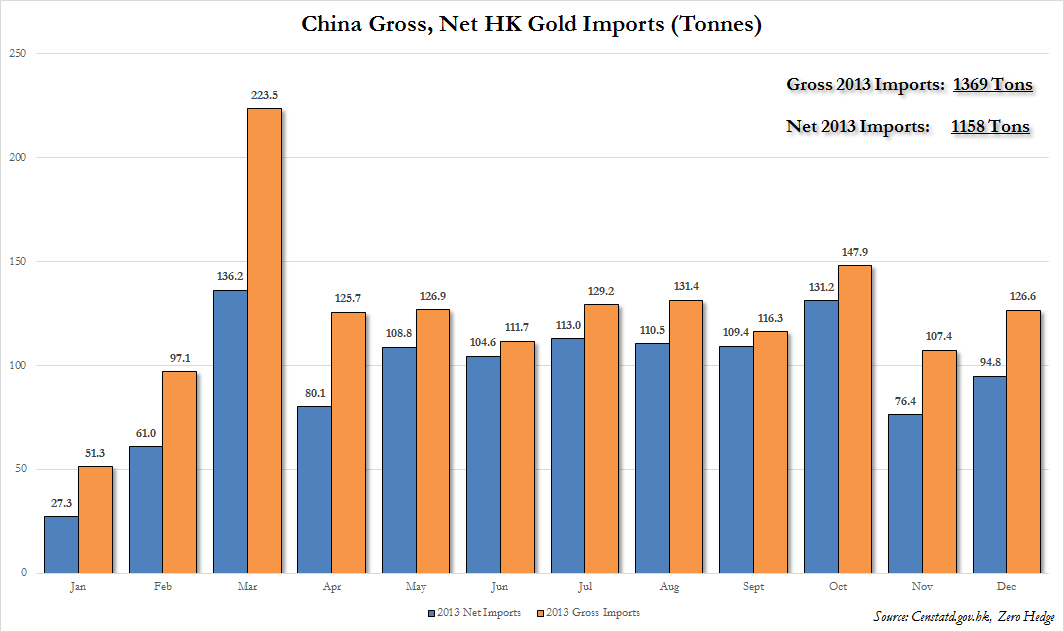
China’s apetite for physical gold, which is further shown below focusing just on 2012 and 2013, has been estimated by Goldman to amount to over $70 billion in bilateral trade between just Hong Kong and China alone.
Yet while China’s gold demand is acutely familiar one question that few have answered is just what is China doing with all this physical gold, aside from filling massive brand new gold vaults of course. And a far more important question: how does China’s relentless buying of physical not send the price of gold into the stratosphere.
We will explain why below.
First, let’s answer the question what purpose does gold serve in China’s credit bubble “Minsky Moment” economy, where as we showed previously, in just the fourth quarter, some $1 trillion in bank assets (mostly NPLs and shadow loans) were created out of thin air.
For the answer, we have to go back to our post from May of 2013 “The Bronze Swan Arrives: Is The End Of Copper Financing China’s “Lehman Event”?“, in which we explained how China uses commodity financing deals to mask the flow of “hot money”, or the one force that has been pushing the Chinese Yuan ever higher, forcing the PBOC to not only expand the USDCNY trading band to 2% recently, but to send the currency tumbling in an attempt to reverse said hot money flows.
One thing deserves special notice: in 2013 the market focus fell almost exclusively on copper’s role as a core intermediary in China Funding Deals, which subsequently was “diluted” into various other commodities after China’s SAFE attempted a crack down on copper funding, which only released other commodities out of the Funding Deal woodwork. We discussed precisely this last week in “What Is The Common Theme: Iron Ore, Soybeans, Palm Oil, Rubber, Zinc, Aluminum, Gold, Copper, And Nickel?”
We emphasize the word “gold” in the previous sentence because it is what the rest of this article is about.
Let’s step back for a minute for the benefit of those 99.9% of financial pundits not intimate with the highly complex concept of China Commodity Funding Deals (CCFDs), and start with a simple enough question, (and answer.)
Just what are CCFDs?
The simple answer: a highly elaborate, if necessarily so, way to bypass official channels (i.e., all those items which comprise China’s current account calculation), and using “shadow” pathways, to arbitrage the rate differential between China and the US.
As Goldman explains, there are many ways to bring hot money into China. Commodity financing deals, overinvoicing exports, and the black market are the three main channels. While it is extremely hard to estimate the relative share of each channel in facilitating the hot money inflows, one can attempt to “ballpark” the total notional amount of low cost foreign capital that has been brought into China via commodity financing deals.
While commodity financing deals are very complicated, the general idea is that arbitrageurs borrow short-term FX loans from onshore banks in the form of LC (letter of credit) to import commodities and then re-export the warrants (a document issued by logistic companies which represent the ownership of the underlying asset) to bring in the low cost foreign capital (hot money) and then circulate the whole process several times per year. As a result, the total outstanding FX loans associated with these commodity financing deals is determined by:
the volume of physical inventories that is involved
commodity prices
the number of circulations
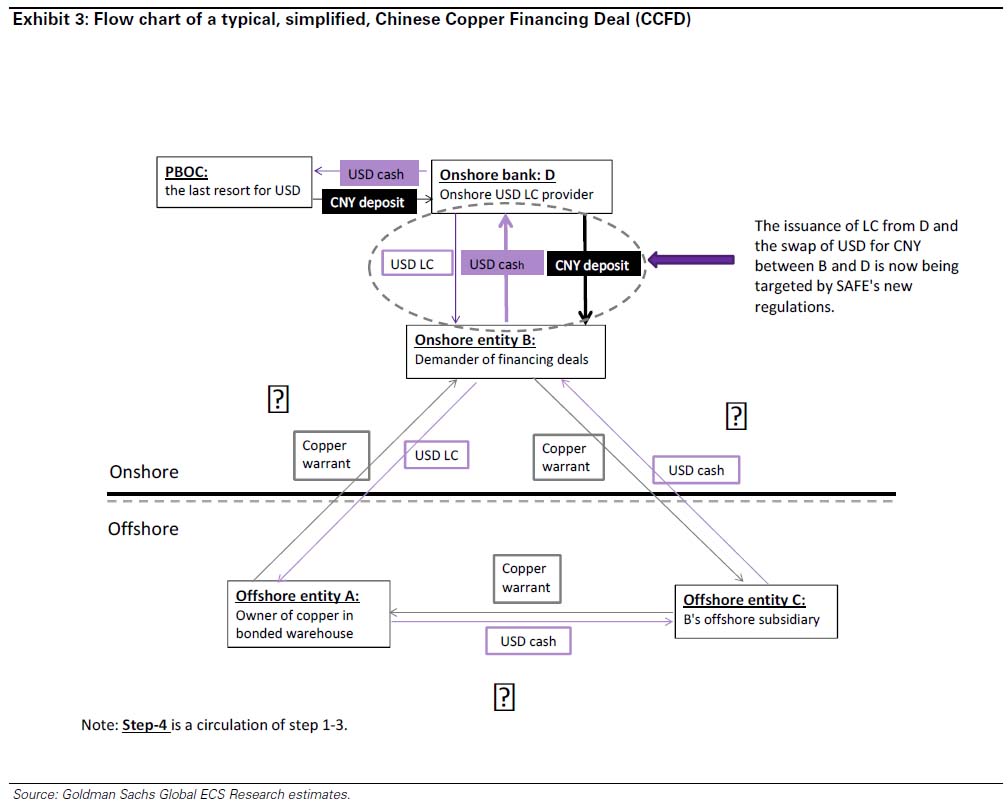
A “simple” schematic involving a copper CCFDs saw shown here nearly a year ago, and was summarized as follows.
As we reported previously citing Goldman data, the commodities that are involved in the financing deals include copper, iron ore, and to a lesser extent, nickel, zinc, aluminum, soybean, palm oil, rubber and, of course, gold. Below are the desired features of the underlying commodity:
- China is heavily reliant on the seaborne market for the commodity
- the commodity has relatively high value-to-density ratio so that the storage fee and transportation cost are relatively low
- the commodity has a long shelf life, so that the underlying value of the commodity will not depreciate significantly during the financing deal period
- the commodity has a very liquid paper market (future/forward/swap) in order to enable effective commodity price risk hedging.
Here we finally come to the topic of gold because gold is an obvious candidate for commodity financing deals, given it has a high value-to-density ratio, a well-developed paper market and very long “shelf life.” Curiously iron ore is not as suitable, based on most of these metrics, and yet according to recent press reports seeking to justify the record inventories of iron ore at Chinese ports, it is precisely CCFDs that have sent physical demand for iron through the proverbial (warehouse) roof.
Gold, on the other hand, is far less discussed in the mainstream press in the context of CCFDs and yet it is precisely its role in facilitating hot money flows, perhaps far more so than copper and even iron ore combined, that is so critical for China, and explains the record amount of physical gold imports by China in the past three years.
Chinese gold financing deals are processed in a different way compared with copper financing deals, though both are aimed at facilitating low cost foreign capital inflow to China. Specifically, gold financing deals involve the physical import of gold and export of gold semi-fabricated products to bring the FX into China; as a result, China’s trade data does reflect, at least partially, the scale of China gold financing deals. In contrast, Chinese copper financing deals do not need to physically move the physical copper in and out of China as explained last year so it is not shown in trade data published by China customs.
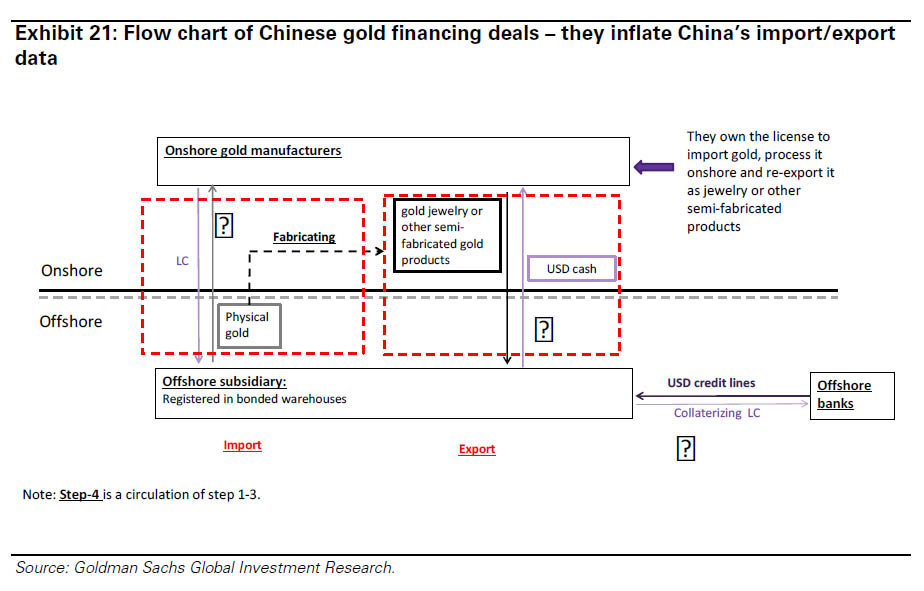
In detail, Chinese gold financing deals includes four steps:
- onshore gold manufacturers pay LCs to offshore7 subsidiaries and import gold from bonded warehouses or Hong Kong to mainland China – inflating import numbers
- offshore subsidiaries borrow USD from offshore banks via collaterizing LCs they received
- onshore manufacturers get paid by USD from offshore subsidiaries and export the gold semi-fabricated products to bonded warehouses – inflating export numbers
- repeat step 1-3
This is shown in the chart below:
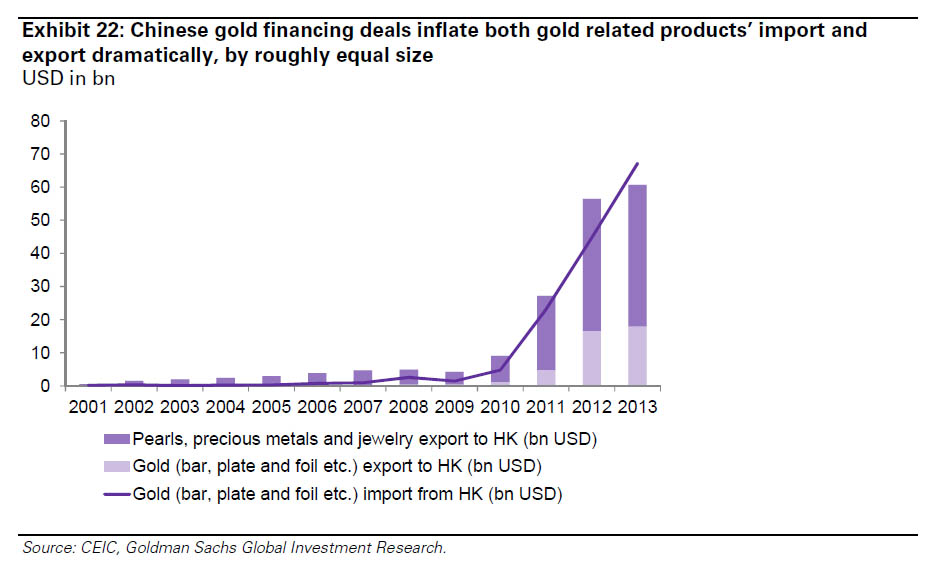
As shown above, gold financing deals should theoretically inflate China’s import and export numbers by roughly the same size. For imports, they inflate China’s total physical gold imports, but inflate exports that are mainly related to gold products, such as gold foils, plates and jewelry. Sure enough, the value of China’s imports of gold from Hong Kong has risen more than 10 fold since 2009 to roughly US$70bn by the end of 2013 while exports of gold and other products have increased by roughly the same amount (shown below). This is in line with the implication of the flow chart on Chinese gold financing deals: the deals inflate both imports and exports by roughly equal size.
Given this, that the rapid growth of the market size of gold trading between China and Hong Kong created from 2009 (less than US$5bn) to 2013 (roughly US$70bn) is most likely driven by gold financing deals.
However, a larger question remains unknown, namely that as Goldman observes, “we don’t know how many tons of physical gold are used in the deals since we don’t know the number of circulations, though we believe it is much higher than that for copper financing deals.”
Recall the flowchart for copper funding deals:
- Step 1) offshore trader A sells warrant of bonded copper (copper in China’s bonded warehouse that is exempted from VAT payment before customs declaration) or inbound copper (i.e. copper on ship in transit to bonded) to onshore party B at price X (i.e. B imports copper from A), and A is paid USD LC, issued by onshore bank D. The LC issuance is a key step that SAFE’s new policies target.
- Step 2) onshore entity B sells and re-exports the copper by sending the warrant documentation (not the physical copper which stays in bonded warehouse ‘offshore’) to the offshore subsidiary C (N.B. B owns C), and C pays B USD or CNH cash (CNH = offshore CNY). Using the cash from C, B gets bank D to convert the USD or CNH into onshore CNY, and trader B can then use CNY as it sees fit.
- Step 3) Offshore subsidiary C sells the warrant back to A (again, no move in physical copper which stays in bonded warehouse ‘offshore’), and A pays C USD or CNH cash with a price of X minus $10-20/t, i.e. a discount to the price sold by A to B in Step 1.
- Step 4) Repeat Step 1-Step 3 as many times as possible, during the period of LC (usually 6 months, with range of 3-12 months). This could be 10-30 times over the course of the 6 month LC, with the limitation being the amount of time it takes to clear the paperwork. In this way, the total notional LCs issued over a particular tonne of bonded or inbound copper over the course of a year would be 10-30 times the value of the physical copper involved, depending on the LC duration.
In other words, the only limit on the amount of leverage, aka rehypothecation of copper, was limited only by letter of credit logistics (i.e. corrupt bank back office administrator efficiency), as there was absolutely no regulatory oversight and limitation on how many times the underlying commodity can be recirculated in a CCFD…. And gold is orders of magnitude higher!
Despite the uncertainty surrounding the actual leverage and recirculation of the physical, Goldman has made the following estimation:
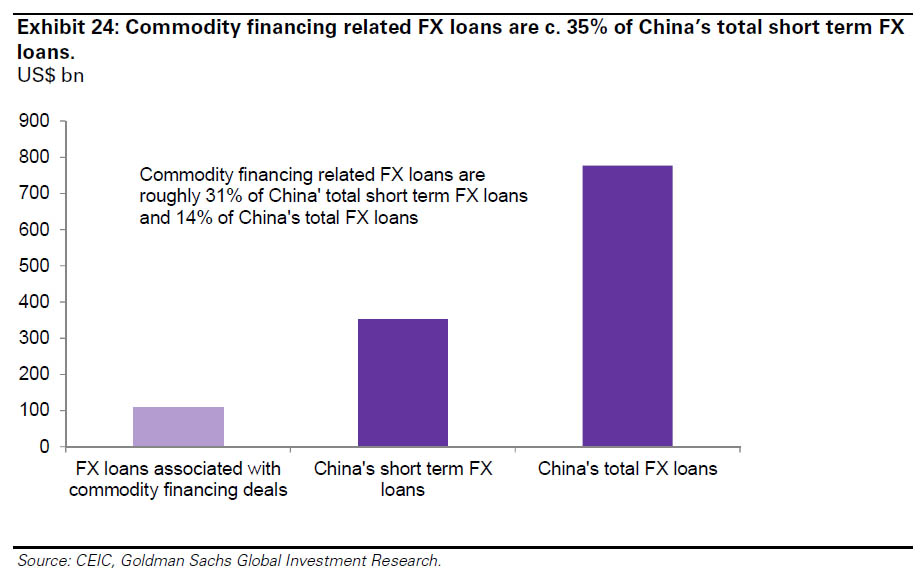
We estimate, albeit roughly, that there are c.US$81-160 bn worth of outstanding FX loans associated with commodity financing deals – with the share of each commodity shown in Exhibit 23. To put it into context, the commodity-related outstanding FX borrowings are roughly 31% of China’s short-term FX loans (duration less than 1 year) .
Putting the estimated role of gold in China’s primary hot money influx pathway, at $60 billion notional, it is nearly three time greater than the well-known Copper Funding Deals, and higher than all other commodity funding deals combined!
Under what conditions would Chinese commodity financing deals take place. Goldman lists these as follows:
- the China and ex-China interest rate differential (the primary source of revenue),
- CNY future curve (CNY appreciation is a revenue, should the currency exposure be not hedged),
- the cost of commodity storage (a cost),
- the commodity market spread (the spread is the difference between the futures
- China’s capital controls remain in place (otherwise CCFD would not be necessary).
All of these components are exogenous to the commodity market, except one – the commodity market spread. This reveals an important point that financing deals are, in general, NOT independent of commodity market fundamentals. If the commodity market moves into deficit, or if the financing demand for the commodity is greater than its finite supply of above ground inventory, the commodity market spread adjusts to disincentivize financing deals by making them unprofitable (thus making the physical inventory available to the market).
Via ‘financing deals’, the positive interest rate differential between China and ex-China turns commodities such as copper from negative carry assets (holding copper incurs storage cost and financing cost) to positive carry assets (interest rate differential revenue > storage cost and financing cost). This change in the net cost of carry affects the spreads, placing upward pressure on the physical price, and downward pressure on the futures price, all else equal, making physical-future price differentials higher than they otherwise would be.
* * *
That bolded, underlined sentence is a direct segue into the second part of this article, namely how is it possible that China imports a mindblowing 1400 tons of physical, amounting to roughly $70 billion in notional, demand which under normal conditions would send the equilibrium price soaring, and yet the price not only does not go up, but in fact drops.
The answer is simple: the gold paper market.
And here is, in Goldman’s own words, is an explanation of the missing link between the physical and paper markets. To be sure, this linkage has been proposed and speculated repeatedly by most, especially those who have been stunned by the seemingly relentless demand for physical without accompanying surge in prices, speculating that someone is aggressively selling into the paper futures markets to offset demand for physical.
Now we know for a fact. To wit from Goldman:
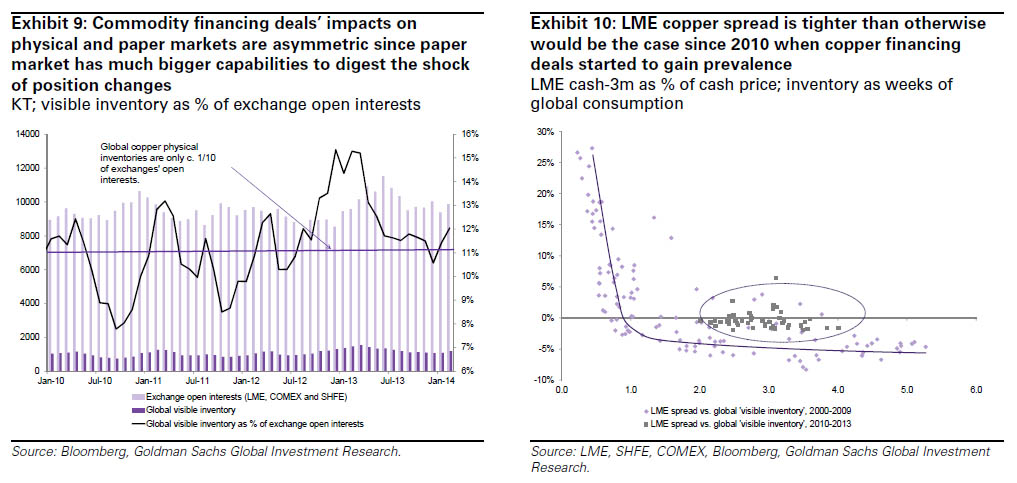
From a commodity market perspective, financing deals create excess physical demand and tighten the physical markets, using part of the profits from the CNY/USD interest rate differential to pay to hold the physical commodity. While commodity financing deals are usually neutral in terms of their commodity position owing to an offsetting commodity futures hedge, the impact of the purchasing of the physical commodity on the physical market is likely to be larger than the impact of the selling of the commodity futures on the futures market. This reflects the fact that physical inventory is much smaller than the open interest in the futures market. As well as placing upward pressure on the physical price, Chinese commodity financing deals ‘tighten’ the spread between the physical commodity price and the futures price .
Goldman concludes that “an unwind of Chinese commodity financing deals would likely result in an increase in availability of physical inventory (physical selling), and an increase in futures buying (buying back the hedge) – thereby resulting in a lower physical price than futures price, as well as resulting in a lower overall price curve (or full carry).” In other words, it would send the price of the underlying commodity lower.
We agree that this may indeed be the case for “simple” commodities like copper and iron ore, however when it comes to gold, we disagree, for the simple reason that it was in 2013, the year when Chinese physical buying hit an all time record, be it for CCFD purposes as suggested here, or otherwise, the price of gold tumbled by some 30%! In other words, it is beyond a doubt that the year in which gold-backed funding deals rose to an all time high, gold tumbled. To be sure this was not due to the surge in demand for Chinese (and global) physical. If anything, it was due to the “hedged” gold selling by China in the “paper”, futures market.
And here we see precisely the power of the paper market, where it is not only China which was selling specifically to keep the price of the physical gold it was buying with reckless abandon flat or declining, but also central and commercial bank manipulation, which from a “conspiracy theory” is now an admitted fact by the highest echelons of the statist regime. and not to mention market regulators themselves.
Which answers question two: we now know that of all speculated entities who may have been selling paper gold (since one can and does create naked short positions out of thin air), it was likely none other than China which was most responsible for the tumble in price in gold in 2013 – a year in which it, and its billionaire citizens, also bought a record amount of physical gold (much of its for personal use of course – just check out those overflowing private gold vaults in Shanghai.
* * *
This brings us to the speculative conclusion of this article: when we previously contemplated what the end of funding deals (which the PBOC and the China Politburo seems rather set on) may mean for the price of other commodities, we agreed with Goldman that it would be certainly negative. And yet in the case of gold, it just may be that even if China were to dump its physical to some willing 3rd party buyer, its inevitable cover of futures “hedges”, i.e. buying gold in the paper market, may not only offset the physical selling, but send the price of gold back to levels seen at the end of 2012 when gold CCFDs really took off in earnest.
In other words, from a purely mechanistical standpoint, the unwind of China’s shadow banking system, while negative for all non-precious metals-based commodities, may be just the gift that all those patient gold (and silver) investors have been waiting for. This of course, excludes the impact of what the bursting of the Chinese credit bubble would do to faith in the globalized, debt-driven status quo. Add that into the picture, and into the future demand for gold, and suddenly things get really exciting.




If you can believe it.
China lies about everything. The gold is probably held by oligarchs, not the government…..it is too deeply in debt and trouble of it’s own…….it is much worse off than any other nation on earth.
It is as absurd as the idea Belgium is holding 3rd place majority in US debt……..Belgium nearly went bankrupt less than two years ago, and barely has a total income of half of what is claimed they hold in US debt. It is all lies.
People can believe none of what they hear and less than half of what they see. Every nation on earth is lying through it’s teeth.
If one were to add up all the known gold in the world, it would fill 3-4 Olympic swimming pools. Every nation claims to have lots of it……….
Come on. It is time to wake up and face the truth. China is NOT the coming world economic leader……Russia probably is……..the US and Eurozone are sinking, and who knows what might be in Africa? I don’t know, but I don’t believe anything China claims about its wealth.
China has many empty ghost towns, beautiful, but none of their citizens can afford living there. Unemployment is very high, there are hundreds of riots every day, and it is all suppressed by Chinese media. They built the world’s biggest building, complete with artificial seashore over 100 miles from any body of water. Only problem…..it is empty.
China adopted the worst economic policies of the west, and dumped all their good ones, such as extended families and caring for their own. Their socialized medical care is gone, replaced by one like the US. If you have money, you get care. If not, die.
I wouldn’t believe one word out of China. They lie about their exports, ask every nation that has dealt with them…..they inflate the numbers regardless the receiving nation also has records showing far less. They depended too much on exports, nothing on growth. Their people grow poorer, while their air and water grow more filthy.
Believe nothing from them.