– The Fed Has Another $3.9 Trillion In QE To Go (At Least) (ZeroHedge, Sep 23, 2012):
Some wonder why we have been so convinced that no matter what happens, that the Fed will have no choice but to continue pushing the monetary easing pedal to the metal. It is actually no secret: we explained the logic for the first time back in March of this year with “Here Is Why The Fed Will Have To Do At Least Another $3.6 Trillion In Quantitative Easing.” The logic, in a nutshell, is simple: everyone who looks at modern monetary practice (as opposed to theory) through the prism of a 1980s textbook is woefully unprepared for the modern capital markets reality for one simple reason: shadow banking; and when accounting for the ongoing melt of shadow banking credit intermediates, which continues to accelerate, the Fed has a Herculean task ahead of it in restoring consolidated credit growth.Shadow banking, as we have explained many times most recently here, is merely an unregulated, inflationary-buffer (as it has no matched deposits) which provides the conventional banking credit transformations such as maturity, credit and liquidity, in the process generating term liabilities. In yet other words, shadow banking creates credit money which can then flow into monetary conduits such as economic “growth” or capital markets, however without creating the threat of inflation – if anything shadow banks are the biggest systemic deflationary threat, as due to the relatively short-term nature of their duration exposure, they tend to lock up at the first sing of trouble (see Money Markets breaking the buck within hours of the Lehman failure) and lead to utter economic mayhem unless preempted. Well, preempting the collapse in the shadow banking system is precisely what the Fed’s primary role has so far been, even more so than pushing the S&P to new all time highs. The problem, however, as we will show today, is that even with the Fed’s balance sheet at $2.8 trillion and set to rise to $5 trillion in 2 years, it will not be enough.
Before we begin, we urge readers new to this topic to read some of the more pertinent posts we have written on the issue of shadow banking, as it is not a simple subject. Some of the more relevant ones:
- Will The Record Plunge In Shadow Liabilities Impair Current Account “Shadow” Deficit Funding And Guarantee A Double Dip? – July 2010
- The $30 Trillion “Problem” At The Heart Of Shadow Banking – A Teaser – December 2011
- Here Is Why The Fed Will Have To Do At Least Another $3.6 Trillion In Quantitative Easing – March 2012
- On The Verge Of A Historic Inversion In Shadow Banking – June 2012
- Fed’s John Williams Opens Mouth, Proves He Has No Clue About Modern Money Creation – July 2012
For those who are somewhat familiar with the topic, but not quite, we believe a useful visualization of how traditional bank liabilities (defined simplistically and easily recreated using the Flow of Funds report using total liabilities at U.S.-Chartered Depository Institutions, L.110, plus total liabilities of Foreign Banking Offices in the US, L.111, plus Total Liabilities of Banks in US Affiliates Areas, L.112) which serve as the backbone of the entire US fractional reserve banking system, compare to US GDP is in order.
More than anything the chart above, which shows the amounts of traditional bank liabilities and GDP on the same Y axis, confirms one simple thing: economic “growth” is only and nothing more than an increase in systemic credit, aka money creation (just as Ray Dalio observed a few days ago). The problem with traditional bank liabilities is that for the most part they have corresponding money aggregates in the form of M2, which in turn is primarily fungible deposits, as an opportunity cost. And, as Germans living in the 1920s recall all too well, putting meaningless theory aside, deposits, when escaping the fractional reserve system and used to pursue hard assets, are the primary driver of such unpleasant monetary events as hyperinflation.
The nuisance that are “deposits” is also why the banking system is desperate to prevent bank runs, which are not so much a threat to systemic liquidity: any central bank can and will step in and guarantee all the banks’ viability overnight if it has to, as it did at the peak of the financial crisis, but an asset allocation decision to shift out of an asset equivalency system built upon faith, and into a mode of hard asset ownership, based on lack of faith in the system (it also explains why the Fed hates when you use your cash to buy “worthless” and cash-flow free hard assets as gold, silver, copper, crude, etc). Of course, what happens with asset prices should $9 trillion in deposits suddenly exit bank vaults and seek to purchase “stuff” would make even the Hungarian hyperinflationary episode, in which prices doubled every several hours, seem like a walk in the park.
So how to fix this? How to ensure economic growth without the threat of inflation at any corner should a central planner make a false move leading to an uncontrollable bank run and deposit outflow? Simple: create a representation of money without the actual money, i.e., M2 equivalents, whether currency in circulation, or even electronic deposits.
Enter the shadow banking system, which is simply the traditional banking system however without the deposits and without the threat of monetary redemptions from the banking system (and the threat of a collapse of fractional reserve banking): it is quite simply, the essence of bank transformation funded by “faith”, or a system in which credit money is created, but without an offsetting money equivalent unit. It is a system in which assets and liabilities are essentially the same concept, interwoven in a daisy chain of rehypothecated ownership claims, and in which every incremental layer of credit money creation serves to ultimately boost the nominal quantity of credit money in circulation.
What this does is it allows for near infinite credit-money expansion within a financial system, without a threat of inflation. It does, however, not prevent the threat of a deflationary collapse should faith in this same system be shaken, and counterparties demand to be made whole on their exposure, which incidentally peaked at $21 trillion in 2008.
But by far the biggest threat with shadow banking, which perceptive readers have already grasped is nothing but the greatest ponzi scheme ever conceived, is that it works brilliantly in an environment of increasing leverage, but should deleveraging commence, is an asset price black hole, as the entire Schrodinger Asset/Liability Function collapses in on itself upon the realization that there are no real asset at the end of a rehypothecation chain. In other words, the moment a liability is accelerated, due to maturity, request for deliverable or any other inverse “faith” transformations, the jig is up.
As the second chart below shows, one of the primary reasons for the surge in US capital markets beginning in 1980 is not so much the “great moderation”, which was certainly a necessary but not sufficient condition for Dow 36,000, as much as that starting in roughly June of 1982, when shadow liabilities crossed the $1 trillion line for the first time and never looked back, the US shadow banking system became a more and more prevalent form of credit money creation, until it overtook traditional liabilities in 1995 in terms of total notional. While traditional liabilities have historically matched GDP dollar for dollar, when one throws shadow liabilities into the mix, one can see a distinctively different picture: the one below.
But where did all those extra trillions in credit money created via Shadow intermediation end up if not in the economic growth of the US? Why in its capital markets of course! This, ironically, makes sense from a symmetrical point of view. Recall that shadow liabilities, by their nature, are not inflationary as they do not have matched monetary aggregates: the US Stock market is also, at least according to the US government and the economic canon, is ot viewed as being part of any inflationary measurement, even though all it really is deferred purchasing power: for example, if everyone is long AAPL and if everyone manages to cash out at the very top, when the market cap of AAPL is $1 quadrillion (for illustrative purposes), all that cash would then exit the capital market and compete with other former AAPL shareholders for physical goods and services. It is in this sense that the S&P merely is a conduit to the latent inflationary build up that infinite credit money creation can lead to. Implicitly, and as a rational benchmark, this boils down to creating infinite purchasing power based on “faith” in a world of very finite goods and services. Not to get cute about it, but when an infinite purchasing power meets an immovable and very finite universe of goods and services, what one gets is hyperinflation. But that is irrelevant in the topic at hand: we will write more on that in a different post.
As noted above, it all worked great for nearly 30 years… and then Lehman brothers hit. What happened next can only be classified as an epic collapse in shadow banking as all the faith in the system had been extinguished and counterparties, unsure if anyone would be standing tomorrow, demanded an acceleration on their credit, liquidity and maturity transformed liabilities, irrespective of what state or what penalty such acceleration would entail. And this is where the Fed comes in.
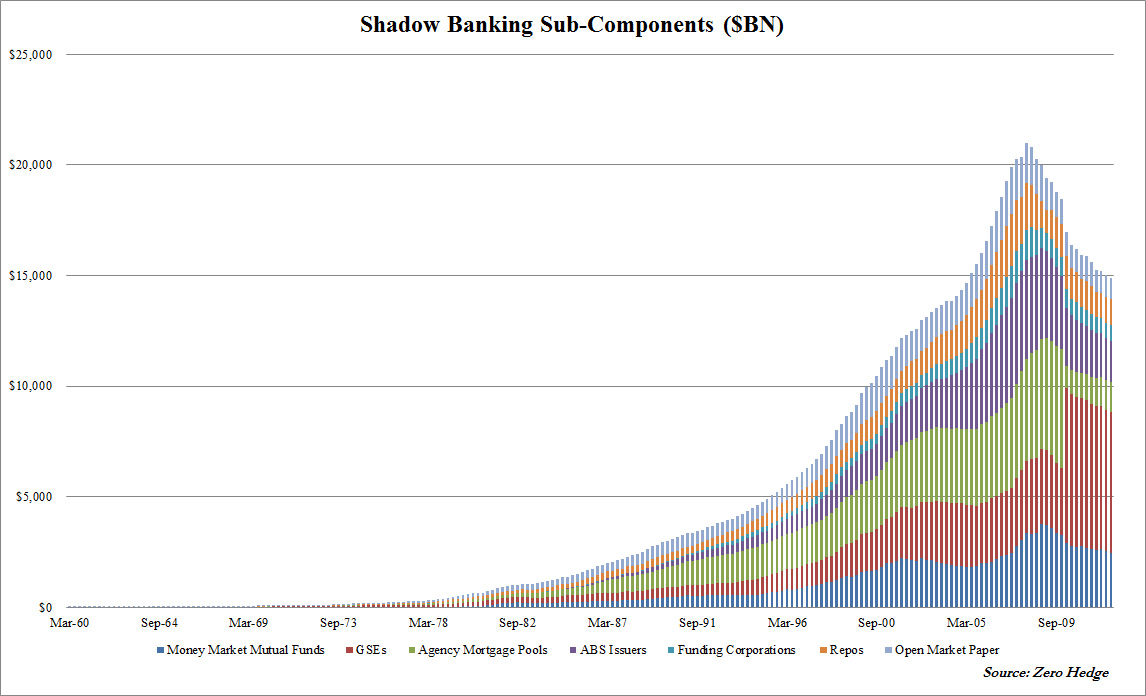
The chart below shows the total amount of shadow liabilities broken up by constituent parts since the 1960s. What is obvious is the exponential surge in notional, hitting a peak of just shy of $21 trillion in Q1 of 2008, and then going straight down.
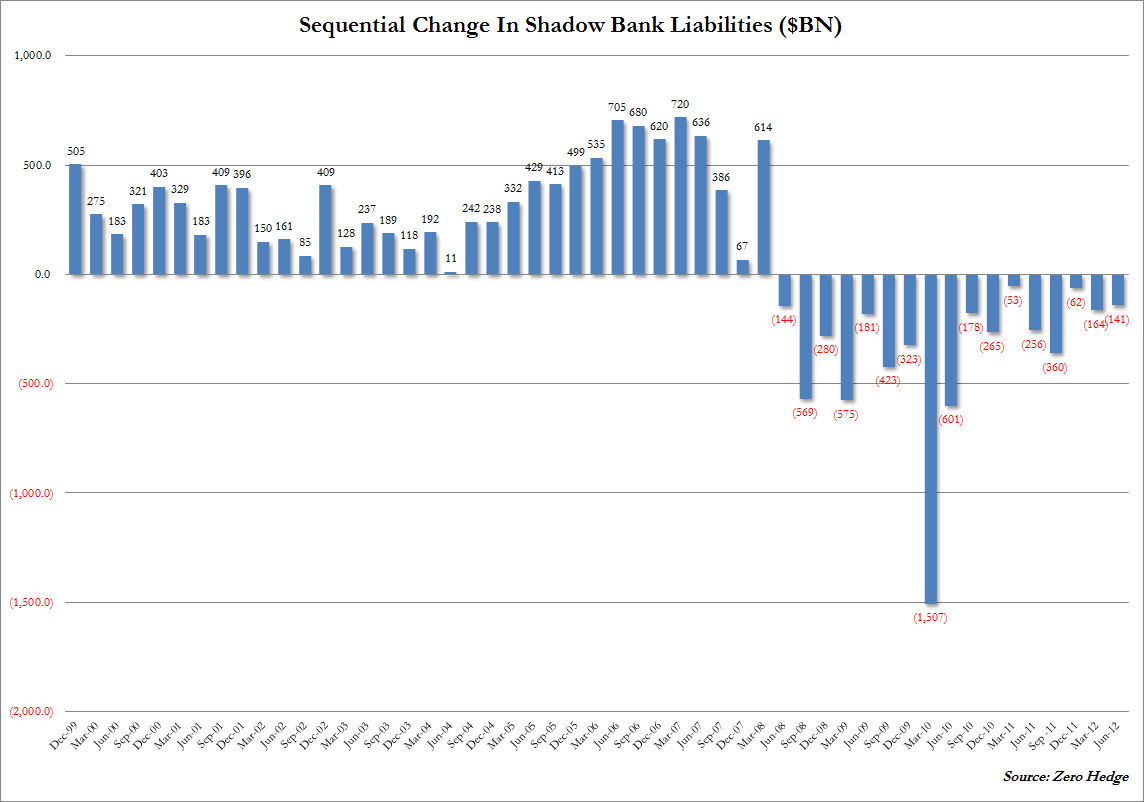
More important, however, is the sequential change in liabilities within this “shadow” system: having grown every quarter for decades until June 2008, things changed rapidly with the end of Lehman brothers, and much to the chagrin of the Fed, have not improved 4 years later. In fact, as the chart shows, the peak draw down in one quarter was a stunning $1.5 trillion in credit money deleveraging in one quarter! This is an amount that all else equal, would have caused an epic collapse in either US GDP or the stock market, as trillions in credit money were taken out of the system. Remember: credit money is fungible, and ‘fractionally reserved.‘ All said, there has been over $6 trillion in deleveraging within shadow banking since the Lehman collapse.
Which brings us to the point of this post.
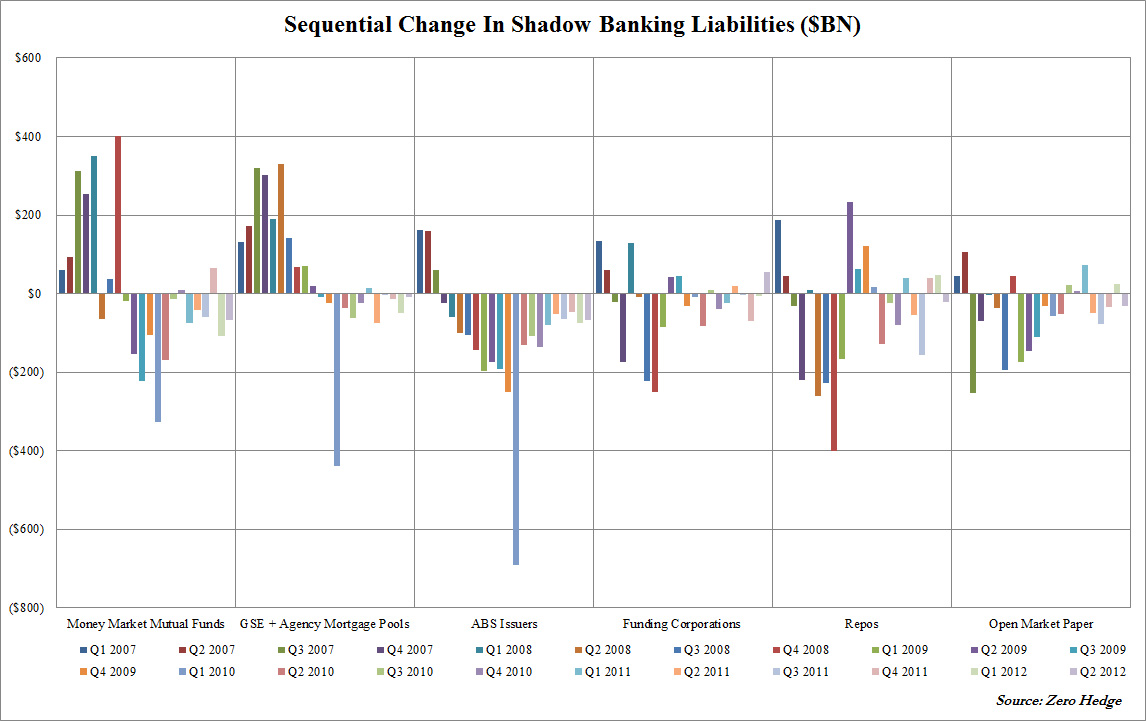
In Q2, as per the just released Flow of Funds report, the deleveraging continued. In fact, between money market funds, GSEs, Agency Mortgage Pools, Asset Backed Security Issuers, Funding Corporations, Repos, and Open Market Paper, also collectively known as “shadow banking liabilities”, in the second quarter the US saw another $141 billion in deleveraging take place, following the $164 billion in Q1, or a total of over $300 billion year to date.
This took the total amount in shadow liabilities to $14.9 trillion for the first time since 2005. It also means that as of right now, the shadow banking system, which continues to deleverage, and the traditional banking system’s liabilities, which continue to grow primarily due to reserve creation by the Fed during periods of unsterilized QE (such as right now courtesy of QEternity), and which amounted to a record $14.9 trillion as well, have reached parity.
This is a historic inversion point for three main reasons:
- As the shadow banking system delevers, the Fed has no choice but to relever traditional bank liabilities, via reserve injection to keep the system at least at equilibrium, if not leveraging at the consolidated level. In both Q1 and Q2 the Fed failed to generate the all critical credit releveraging, as first $110 billion in Q1, and then $58 billion in Q2 credit money exited the closed system via maturities without being rolled over, redemptions, conversion into hard assets, etc.
- Paradoxically, it is precisely due to its action, with which the Fed continues to remove faith in the US financial system as a standalone entity and one that can function effectively without a central bank backstop at every corner, that the ongoing deleveraging within the all critical shadow banking system – the one monetary conduit which as noted above is the closest thing to a inflation-free lunch due to the lack of immediate inflationary threats – continues. As noted above, so far in 2012 there has been $300 billion in deleveraging here alone.
- Completing the Catch 22 loop, the Fed, which is cornered, will continue to do what it does, reflating traditional liabilities, creating reserves, deposits, and currency, all of which have an exponentially greater inflationary propensity that the circular liabilities continued within shadow banking, and which eventually will breach the dam door of inflationary expectations leading to an epic surge in priced in and/or concurrent inflation.
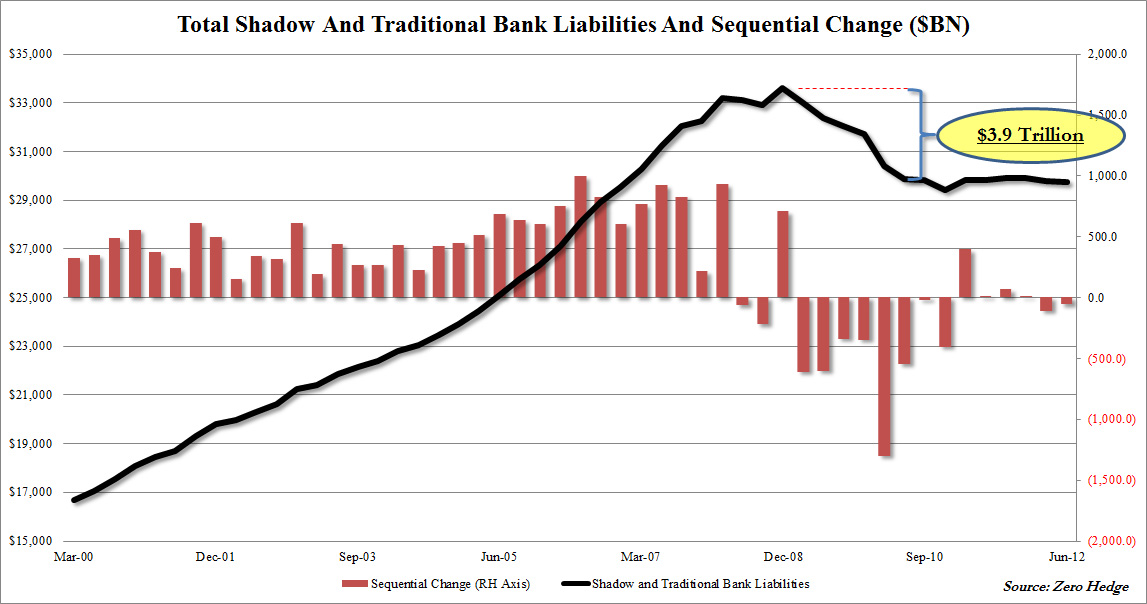
Visually, this can be presented as follows:
The chart above shows what the consolidated deleveraging – combining shadow and traditional banks – since the Lehman collapse. All told there is still a $3.9 trillion hole that need to be plugged for the ‘market’ to simply return back to its 2008 peak credit levels. But what is truly a slap in the face of the Fed, and what confirms that the more the Fed “acts” the more it shoots itself in the foot, is that the last time we did this analysis, the hole was “only” $3.6 trillion. In 6 short months, the Fed’s relentless intervention in markets, managed to force the deleveraging of over quarter of a trillion in additional credit money!
It also explains why the Fed knew long ago, that it would have to engage in a relereving program that offset at least the continuing deleveraring in shadow aggregates: first $40 and then $85 billion a month sounds about right, and is an amount that will at best keep the system at its current state as opposed to actually growing it.
And while one does not have to be a rocket scientist to have grasped by now that all the Fed does is self-defeating, what the above analysis does do is provide a primer to all those Economy PhD’s who still fail to grasp how the modern economy works, specifically why so far the inflationary surge has been deferred.
In short: the more the Fed actively relevers using conventional conduits that spur the threat of inflation, and the more that shadow conduits delever, the greater the risk that inflation will finally come to roost. Because that $3.9 trillion in incremental reserves (and recall that already both BofA and Goldman, following our example, determined that the Fed will need to do at least another $2 trillion in QE, which means much more in reality) that will be created to offset the ongoing shadow deleveraging will simply pump up various asset classes, until the hard asset spillover finally hits, and no matter how much SPR jawboning, no matter how many CME margin hikes, no matter how many Saudi rumors of increase crude production, prices of hard assets will finally explode.
We can at this point say that an inflationary surge is an absolute certainty if not for one thing: if somehow the deleveraging in the shadow banking system is finally offset (and with the GSEs now in runoff mode this is a virtual impossibility), and Bernanke can take his foot off the gas, then there may still be a chance. However, as noted, 4 years in, this has not happened, and it will not happen for one simple reason: at its core, the market, which despite all of Bernanke’s attempt to the contrary, realizes that a centrally planned system is ultimately unsustainable, and quietly, behind the scenes, those who have shadow credit relationships are promptly unwinding them while they still can, and using the proceeds to invest into hard asset for the inevitable T+1 moment.
The bottom line paradox here is that the more forcefully the Fed intervenes, the greater the implicit loss of confidence in the system, the greater the shadow deleveraging, and the more definitive is the ultimate destruction of the capital markets as we know them. Of course, there is still a chance that Bernanke will step back and realize what he is doing. However, since all Bernanke is, is a pawn of those whose wealth is conserved in the US equity tranche, it means that it is now, and has been for the past 4 years, impossible for him to stop.
And in not stopping, Bernanke has sowed the seeds of not only his, but everyone else’s destruction.
* * *
Finally, and confirming the above observations have some basis in actual reality, is the following chart from Citi’s Matt King, who implicitly summarizes everything said above as follows: “Much credit growth was based on collateralized lending.” Well, the collateral has now run out.
And the “wrong horse” is precisely what all those who come up with convenient, three letter goal-seeking theories to justify an ideological bent, are focusing on. If instead of reading 1980s textbooks, all those “modern market” thinkers were to grasp just what it is that drives the market, we might still have a chance.


