
– Ticking TimeBomb: Americans In Horrible Financial Shape Just Prior to The Next Crisis:
We said after the 2008 crisis that the financial system had died. In fact, that was our cue to start The Dollar Vigilante. And we said all they would do was print money to make it seem like the economic system was still functioning until the next major crisis/collapse, which we said was likely to occur between 2015-2020.
And that is exactly what happened as we now sit on the precipice of the next great collapse. Just look at US national debt… it has doubled since 2008! And, we’re now living in a world with negative interest rates. The system is in its final stages. Yet, your average American is more preoccupied about who should be allowed to use which bathroom than about the disintegration of the dollar economy.
And this collapse couldn’t come at a worse time for your average American. Usually, in recent history, busts have come after a boom… meaning that people could, to some extent, manage through the bust. Not this time. Your average American’s solvency has been decimated in the last seven years.
FACTS ABOUT US POVERTY
According to a recently-released Pew Report, one-third of all Americans don’t make enough money to even cover the basic necessities. ONE THIRD. The Pew Charitable Trusts, announced that household spending went up by 14 percent in a decade ending at 2014, but median household income went down 13 percent.
Even by the Federal Reserves own numbers, Americans have been in a depression (earning less and less) since 2000.
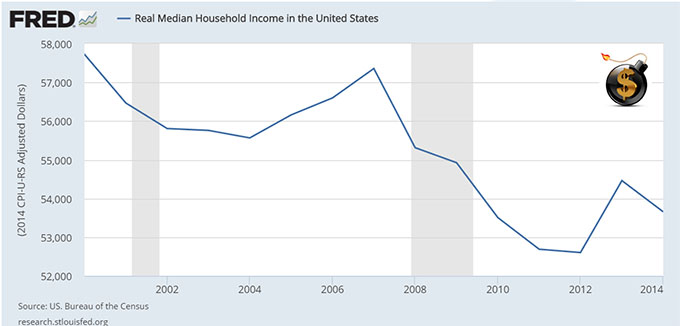
And according to Pew, US families now spend more on housing, food, health care and transportation than a decade ago. In fact, about one-third of all Americans don’t make enough to cover the core necessities.
The one-third of households Pew defines as “low-income” were the worst off. Pew’ estimated that in in 2004, lower-income households plunged into the red by $2,300. A decade ago, bottom-third households had $1,500 left over each year. Today they are $2,300 in the red. One in three American families have no savings.
Even top-level US officials admit the obvious problem: Americans are broke. According to Federal Reserve official William Dudley, America is no longer the top country for achieving the “American Dream” which is fast becoming a nightmare. At the Association for Neighborhood and Housing Development, he said recently, “While income mobility in the United States has been relatively unchanged, it remains well below several other nations. The probability of moving from the bottom quintile to the top quintile is 7.5 percent in the United States, as compared to 11.7 percent in Denmark and 13.5 percent in Canada.”
Socialists may point to Denmark and Canada and say, “See! Extortion rackets work!”… but they don’t realize that many countries, including Canada and Denmark, have inched more towards free-market capitalism in the last decade while the US has rapidly moved more towards a fascist-communist police state.
In 1970, 61% of Americans could be called middle class. Today it’s just 43%. Nearly 50 percent of all 25-year-old Americans are at home with their parents and almost 50 percent of Americans live in a home that receives money from the government (a bankrupt government too). One out of every five children is on food stamps and the media net worth of families has fallen from $137,955 in 2007 to $82,756 today.
Now ask yourself, given these numbers, how will the US fare if/when there is a massive crisis that will make 2008 look like the good ol’ days?
Of course, on the propaganda-box, CNBC is crowing about the Dow having hit 18,000 and good times are here again. They’re not.
CNBC doesn’t mention ANY of the stats we mentioned above. And when they talk about how well the economy is doing they point to stats like the unemployment numbers. They say, look, the economy is doing great, unemployment is now only at 5%!
This is an outright lie. The Bureau of Labor Statistics, or BLS, or as I call it, BS, has removed all “long term” discouraged workers from the unemployment numbers. These are tens of millions of people who have just given up. The changes began to be implemented in 1994 and Shadow Stats still calculates the unemployment numbers solely how they were calculated in 1994. Today, if they had not changed their calculation methods (the blue line below), unemployment would stand at 23%.
An easier way to see the true status of employment in the US, which they haven’t yet managed to skew the numbers, is by using the Federal Reserve’s own calculation of the Civilian Labor Force Participation Rate.

By those calculations, the US has been in a depression since 2000 and employment has been dropping ever since.
Once again, given this state of affairs, how is your average American going to survive, let alone thrive, through the next big crisis/collapse?
This is not going to be pretty. We outlined in our latest viral video how this has all been planned and what will happen next, which you can see here:

We’ve written a free time-limited White Paper on what you can do to survive and profit from this collapse that you can get at SurviveShemitah.com. Please take a look at these resources. They provide a lot more credible information than the mainstream media, which only wants to convince you that the “recession” is over and the recovery is underway. In fact, there is no recovery and the “recession” is actually a depression.
* * *
The Greatest Depression.
* * *
PayPal: Donate in USD
PayPal: Donate in EUR
PayPal: Donate in GBP