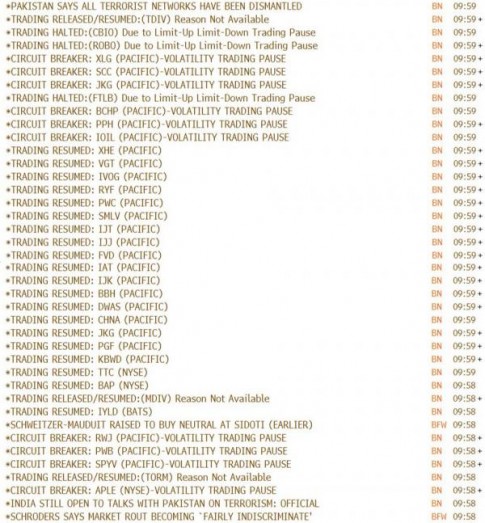
– What Is Really Going On: Market Liquidity Worse Than During The Flash Crash; 4500 Crash Events; Constant Halts And Unhalts (ZeroHedge, Aug 24, 2015):
Curious why few if any traders can actually execute any trades, whether buys or sells? The reason is that despite the relative calmness of the index prints, what is going on beneath the surface is an unprecedented wave of constant halt and unhalts as all stop levels were taken out, many in circuit breaker territory, making it virtually impossible for any matching enginge to, well, match buyers and sellers.
Here is a sample:
The resulting halts made it impossible for regular traders to step in, requiring central banks to buy via the CME’s Central Bank Incentive Program, to restore some market stability.
And just to add to the pain, there is absolutely no liquidity in either stocks…
eMini Liquidity since 2009 – today is the black line $ES_Fpic.twitter.com/2vsXJWxdNI
— Eric Scott Hunsader (@nanexllc) August 24, 2015
Treasury Liquidity (10-year) is as low as it was during Treasury Flash Crash of Oct 15: pic.twitter.com/oZx2nH7vmK
— Eric Scott Hunsader (@nanexllc) August 24, 2015
As the market breaks:
Over 4,500 mini crash events so far today. Compare to last few years: pic.twitter.com/1sKQL6r4k8
— Eric Scott Hunsader (@nanexllc) August 24, 2015
