– The Waiter And Bartender Recovery Is Over: Fewest Food Workers Added Since June 2012 (ZeroHedge, April 3, 2015):
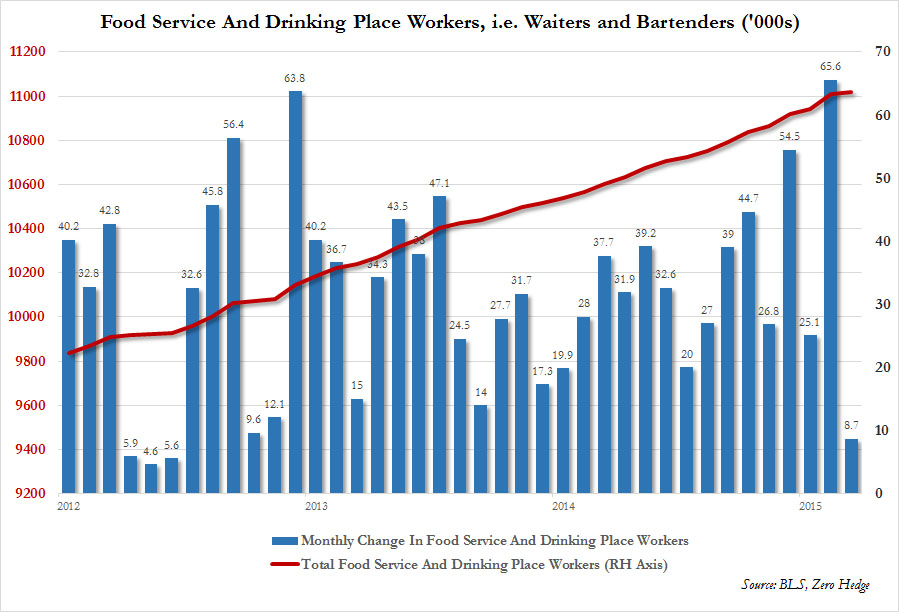
Yesterday we warned that “the whisper expectation is for a NFP print that will be well below consensus, somewhere in the mid-100,000s if not worse now that the bartender hiring spree is over.” As already noted, we were spot on with the abysmal jobs print, the worst since 2013. We were also correct about the end of the “bartender hiring spree” because as the following chart shows, the number of “Food Services and Drinking Places” workers, aka waiters and bartenders just saw its worst monthly increase since June of 2012.
So much for the “waiter and bartender” recovery so heavily praised by the WSJ a month ago.
That said, we also predicted something else earlier today just ahead of the payroll number:
Three things are certain: death, taxes, and this chart hitting new record highs https://t.co/30lg98WVR9
— zerohedge (@zerohedge) April 3, 2015
This, too, was correct, because despite the dramatic slowdown in bartender hiring, the total series just hit a new all time high of 11.017 million waiters and bartenders employed in the US.
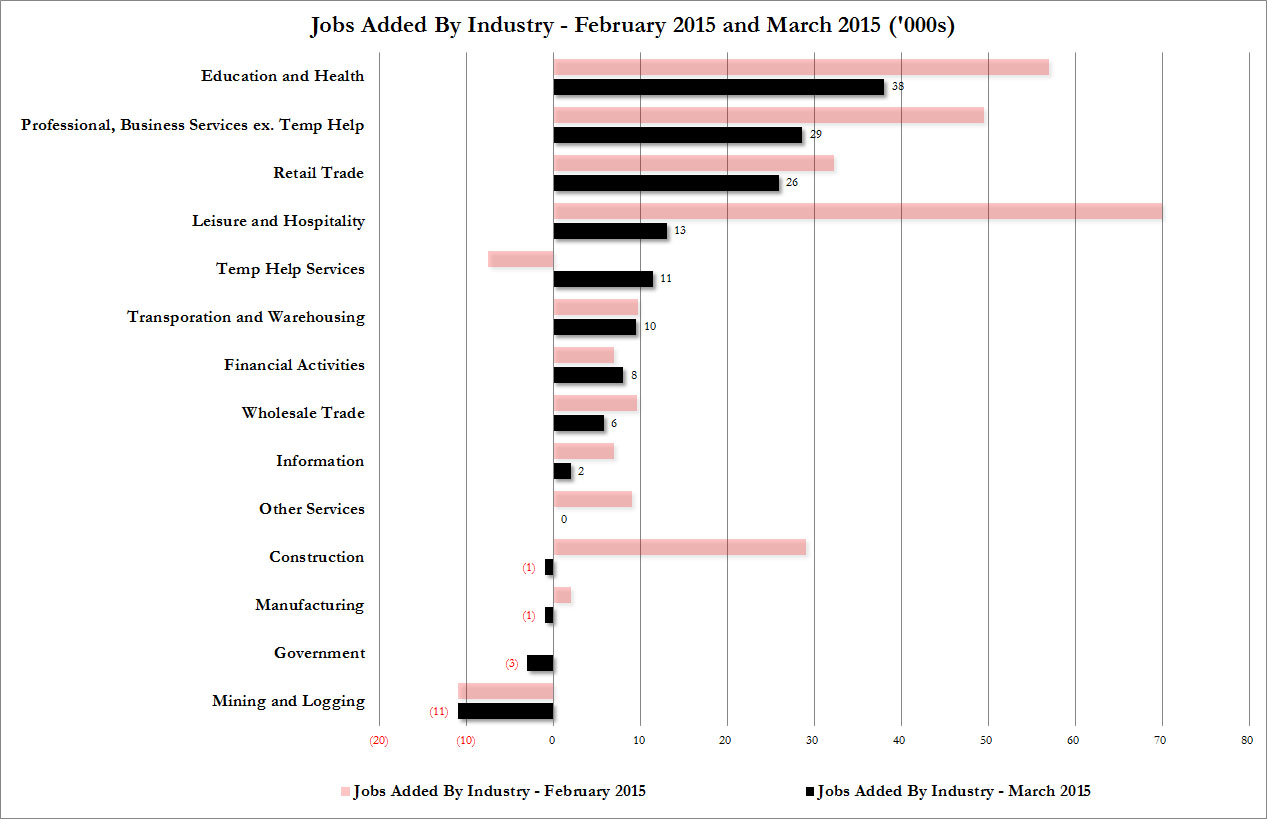
So aside from food workers, what other job categories saw job gains (of Americas 55 and over) in March?
Well, it will hardly come as a surprise, that four of the five most active job categories hiring in March were also the lowest paid:
- Education and Health saw the addition of 38K workers
- Retail Trade added 26K
- Leisure and Hospitality added another 13K
- Temp workers increased by 11K.
We point this out just in case anyone is still worried about “wage growth.”