– The Number Of Days In Which JPM Lost Money In All Of 2013 Is… (ZeroHedge, Feb 20, 2014):
….
0
….
Well, what did you expect.
However, there’s more.
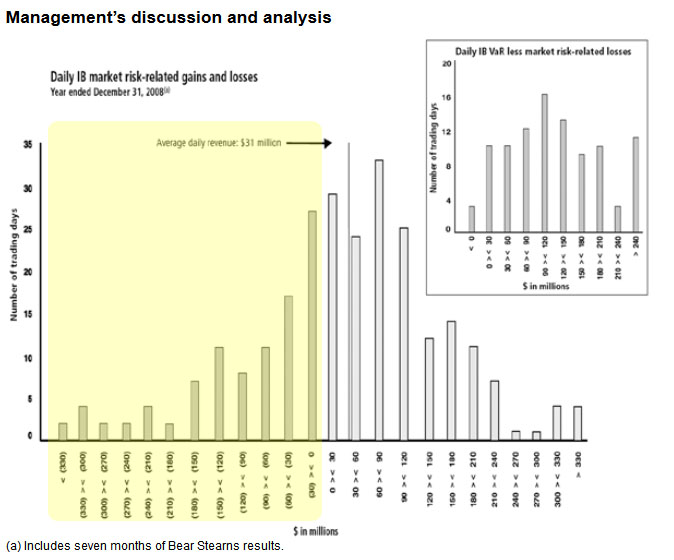
First, the reason why the familiar histogram showing the trading days profits (we would say losses but TBTFs don’t lose money in the New Normal) such as the one seen here is no longer present, is because JPM has decided to no longer show it as of this quarter.
Prior to the fourth quarter of 2013, the Firm disclosed a histogram which presented the results of daily backtesting against its daily market risk-related gains and losses for positions included in the Firm’s Risk Management VaR calculation. Under this previous presentation, the market risk related revenue was defined as the change in value of: principal transactions revenue for CIB, and Treasury and CIO; trading-related net interest income for CIB, Treasury and CIO, and Mortgage Production and Mortgage Servicing in CCB; CIB brokerage commissions, underwriting fees or other revenue; revenue from syndicated lending facilities that the Firm intends to distribute; mortgage fees and related income for the Firm’s mortgage pipeline and warehouse loans, MSRs, and all related hedges; and market-risk related revenue from Asset Management hedges; gains and losses from DVA were excluded.
If JPM had used this old methodology, JPM would have shown the following: “Under this prior measure there were no VaR band breaks nor any trading loss days for the year ended December 31, 2013.”
Needless to say, this has never happened before.
So what’s wrong with no trading losses: after all a bank works mostly on a flow basis, right, so the customers take on principal risk, right? Wrong.
We already know for a fact that JPM’s primary business model until the beaching of the London Whale was abusing excess deposits and using them precisely as prop trading capital. However, for the best picture of the firm’s Old Normal trading day win/loss distribution, we go back to JPM’s trading day histogram for 2008. This is what it should look like.
Perhaps it is out of shame that JPM did not want to disclose the fact that based on an apples to apples methodology the firm no longer loses money. Any money. Ever. So what did JPM do? Why it introduced oranges of course. From the just released 10-K:
Effective during the fourth quarter of 2013, the Firm revised its definition of market risk-related gains and losses to be consistent with the definition used by the banking regulators under Basel 2.5. Under this definition market risk-related gains and losses are defined as: profits and losses on the Firm’s Risk Management positions, excluding fees, commissions, fair value adjustments, net interest income, and gains and losses arising from intraday trading. The following chart compares the daily market risk-related gains and losses on the Firm’s Risk Management positions for the year ended December 31, 2013, under the revised definition. As the chart presents market risk-related gains and losses related to those positions included in the Firm’s Risk Management VaR, the results in the table below differ from the results of backtesting disclosed in the Firm’s Basel 2.5 report, which are based on Regulatory VaR. The chart shows that for the year ended December 31, 2013, the Firm observed two VaR band breaks and posted gains on 177 of the 260 days in this period.
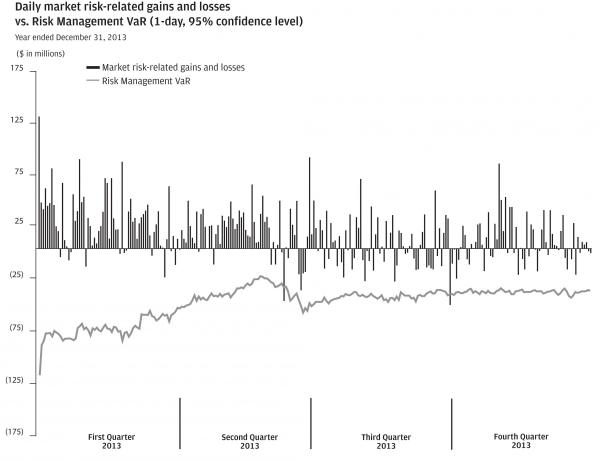
In other words when one excludes such trivial things as “f,ees, commissions, fair value adjustments, net interest income, and gains and losses arising from intraday trading” and why one would exclude gains and losses from intraday trading when the bulk of JPM’s revenue comes precisely from this is beyond us, JPM did in fact lose money. It just didn’t lose money when everything is included.
And that, among all the other well-known reasons, is why Jamie Dimon is once again richer than you.