Bulk Shipping Bankruptices Begin As Baltic Dry Collapse Continues

Bulk Shipping Bankruptices Begin As Baltic Dry Collapse Continues (ZeroHedge, Feb 5, 2015):

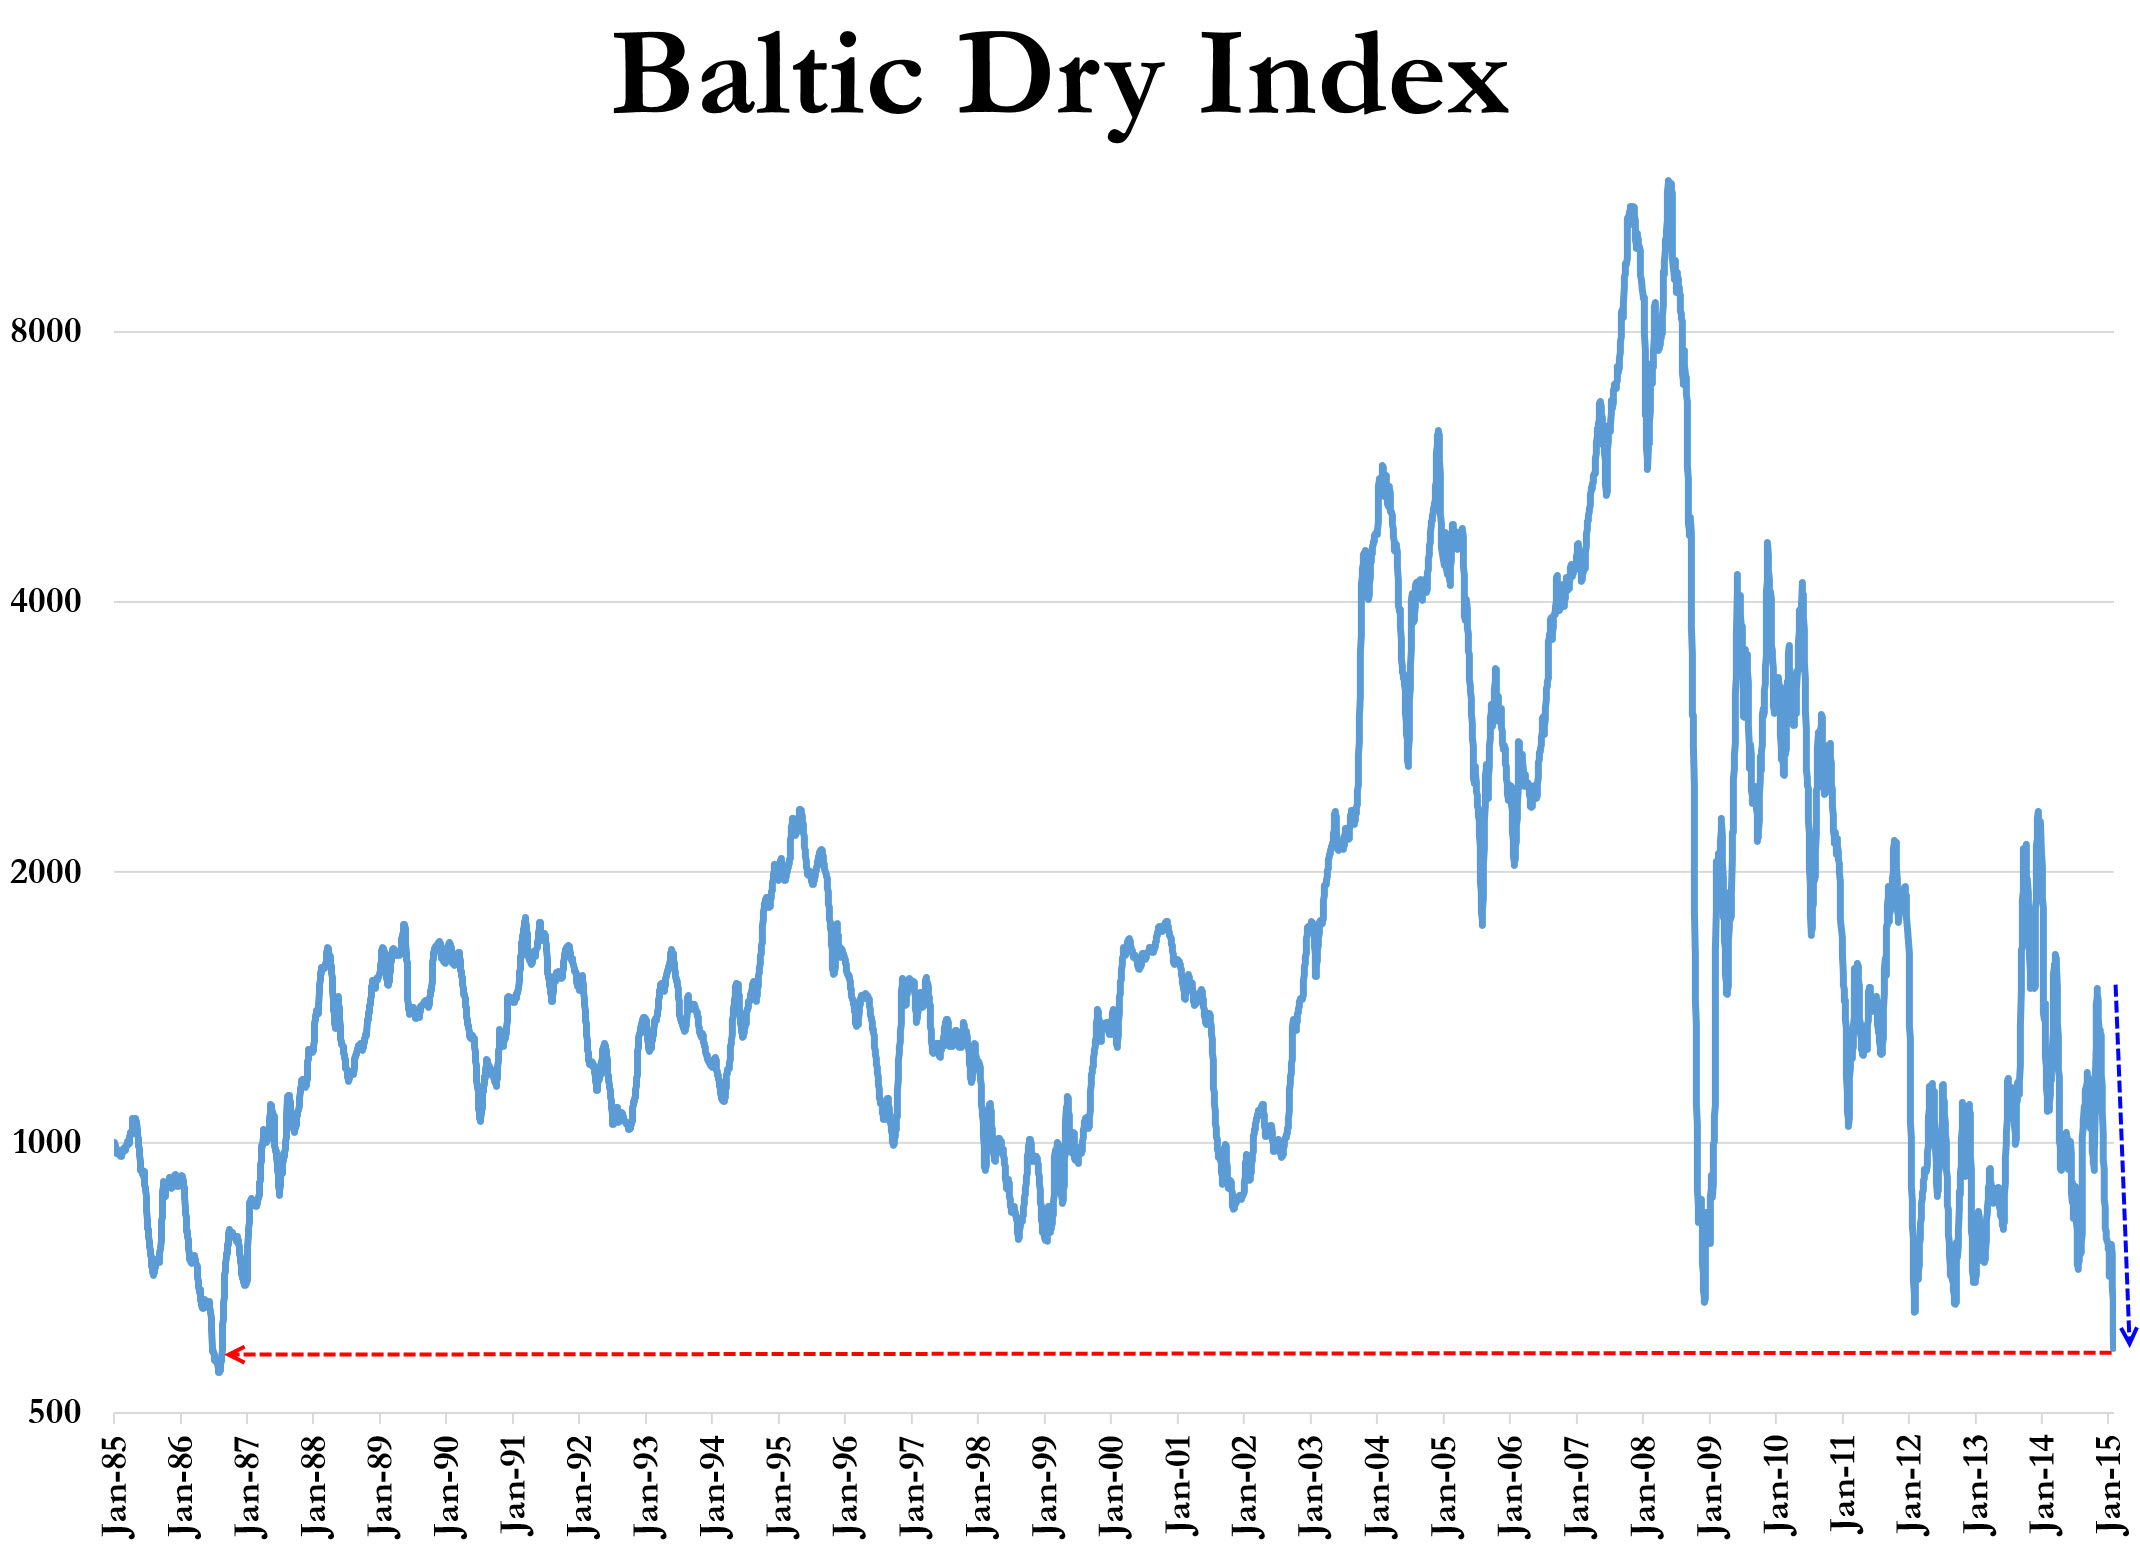
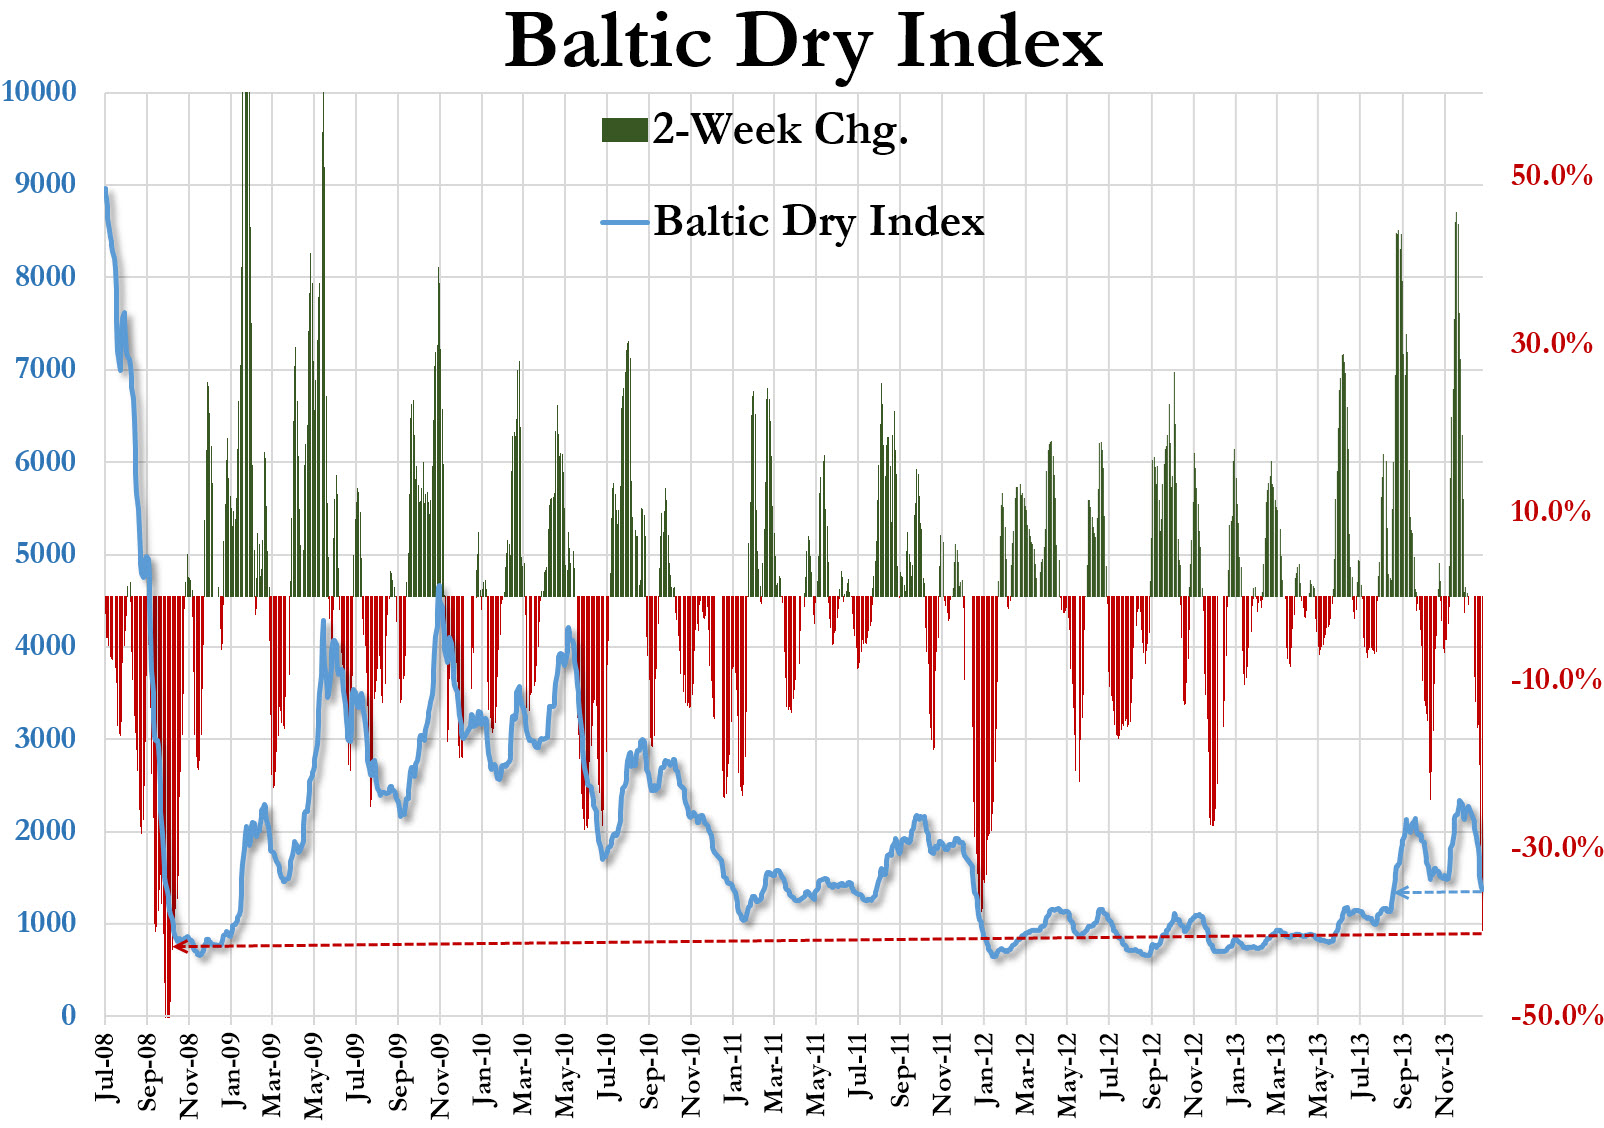
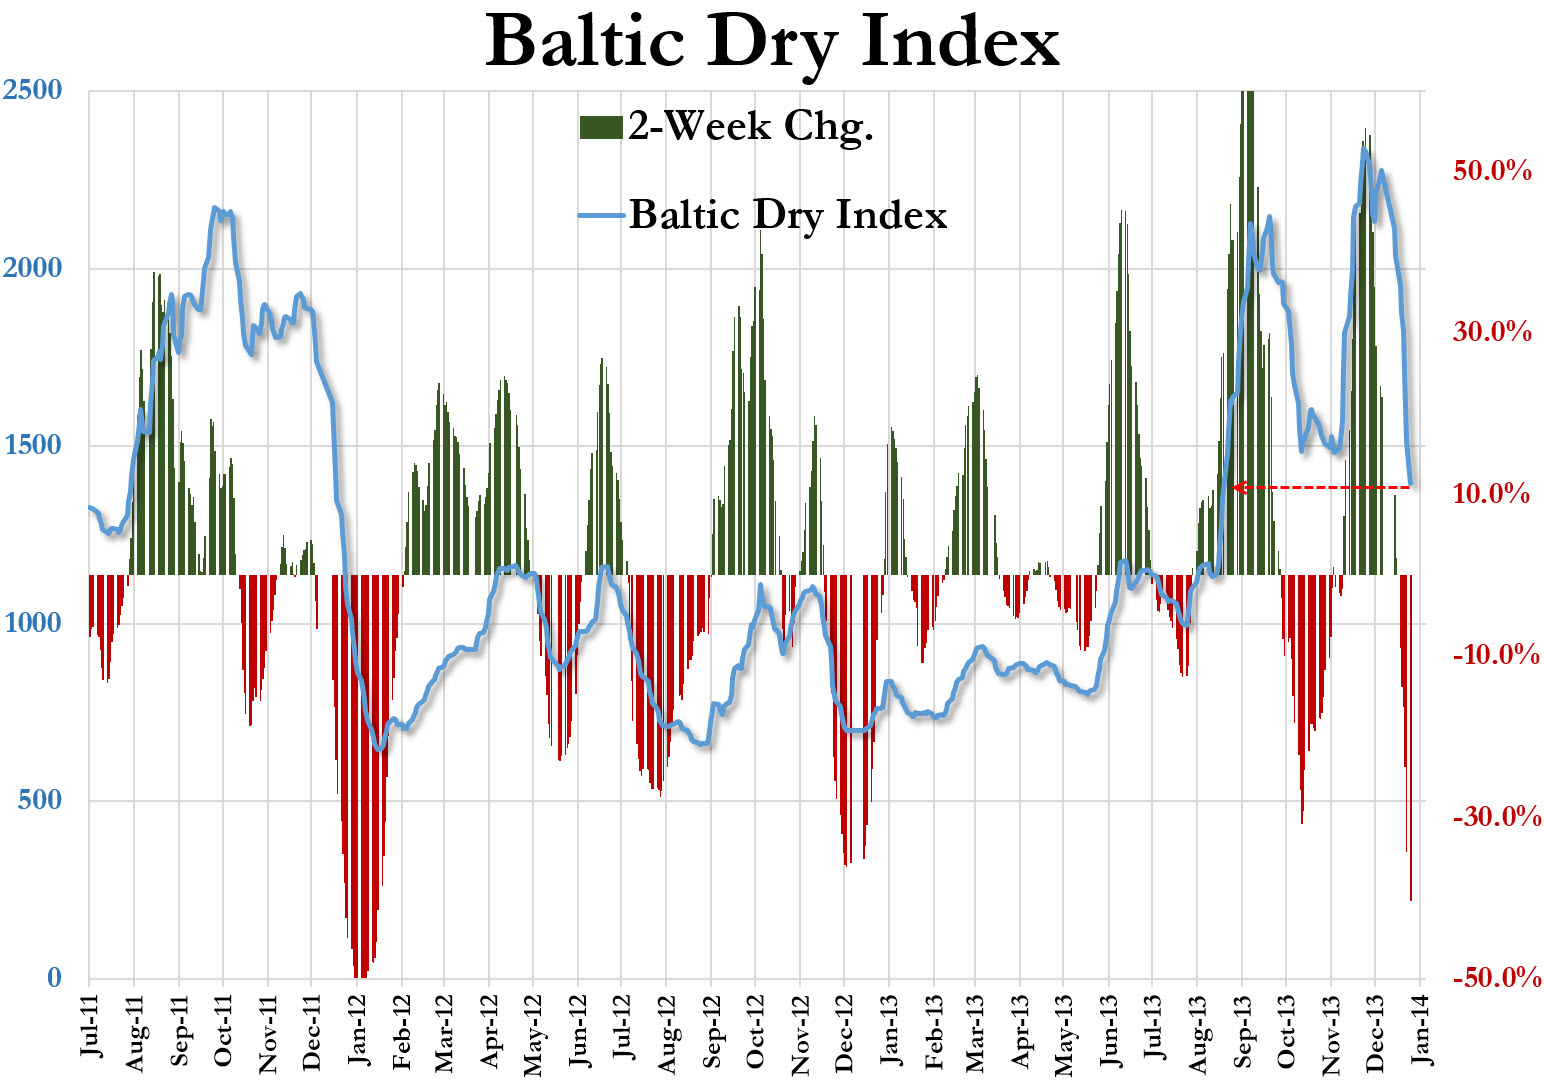
With one of the world’s leading dry bulk shipping companies, Copenhagen-based D/S Norden, having made huge losses for the last 2 years and expected to report dramatic losses in 2014 also, it is hardly surprising that the smaller bulk shipping firms are struggling as The Baltic Dry Index collapses ever closer to record all-time lows. As Reuters reports, privately-owned shipping company Copenship has filed for bankruptcy in Copenhagen after losses in the dry bulk market, with the CEO exclaiming, “we have reached a point where there is not more to do.” We suspect, given the crash in shipping fees, that this is the first of many…

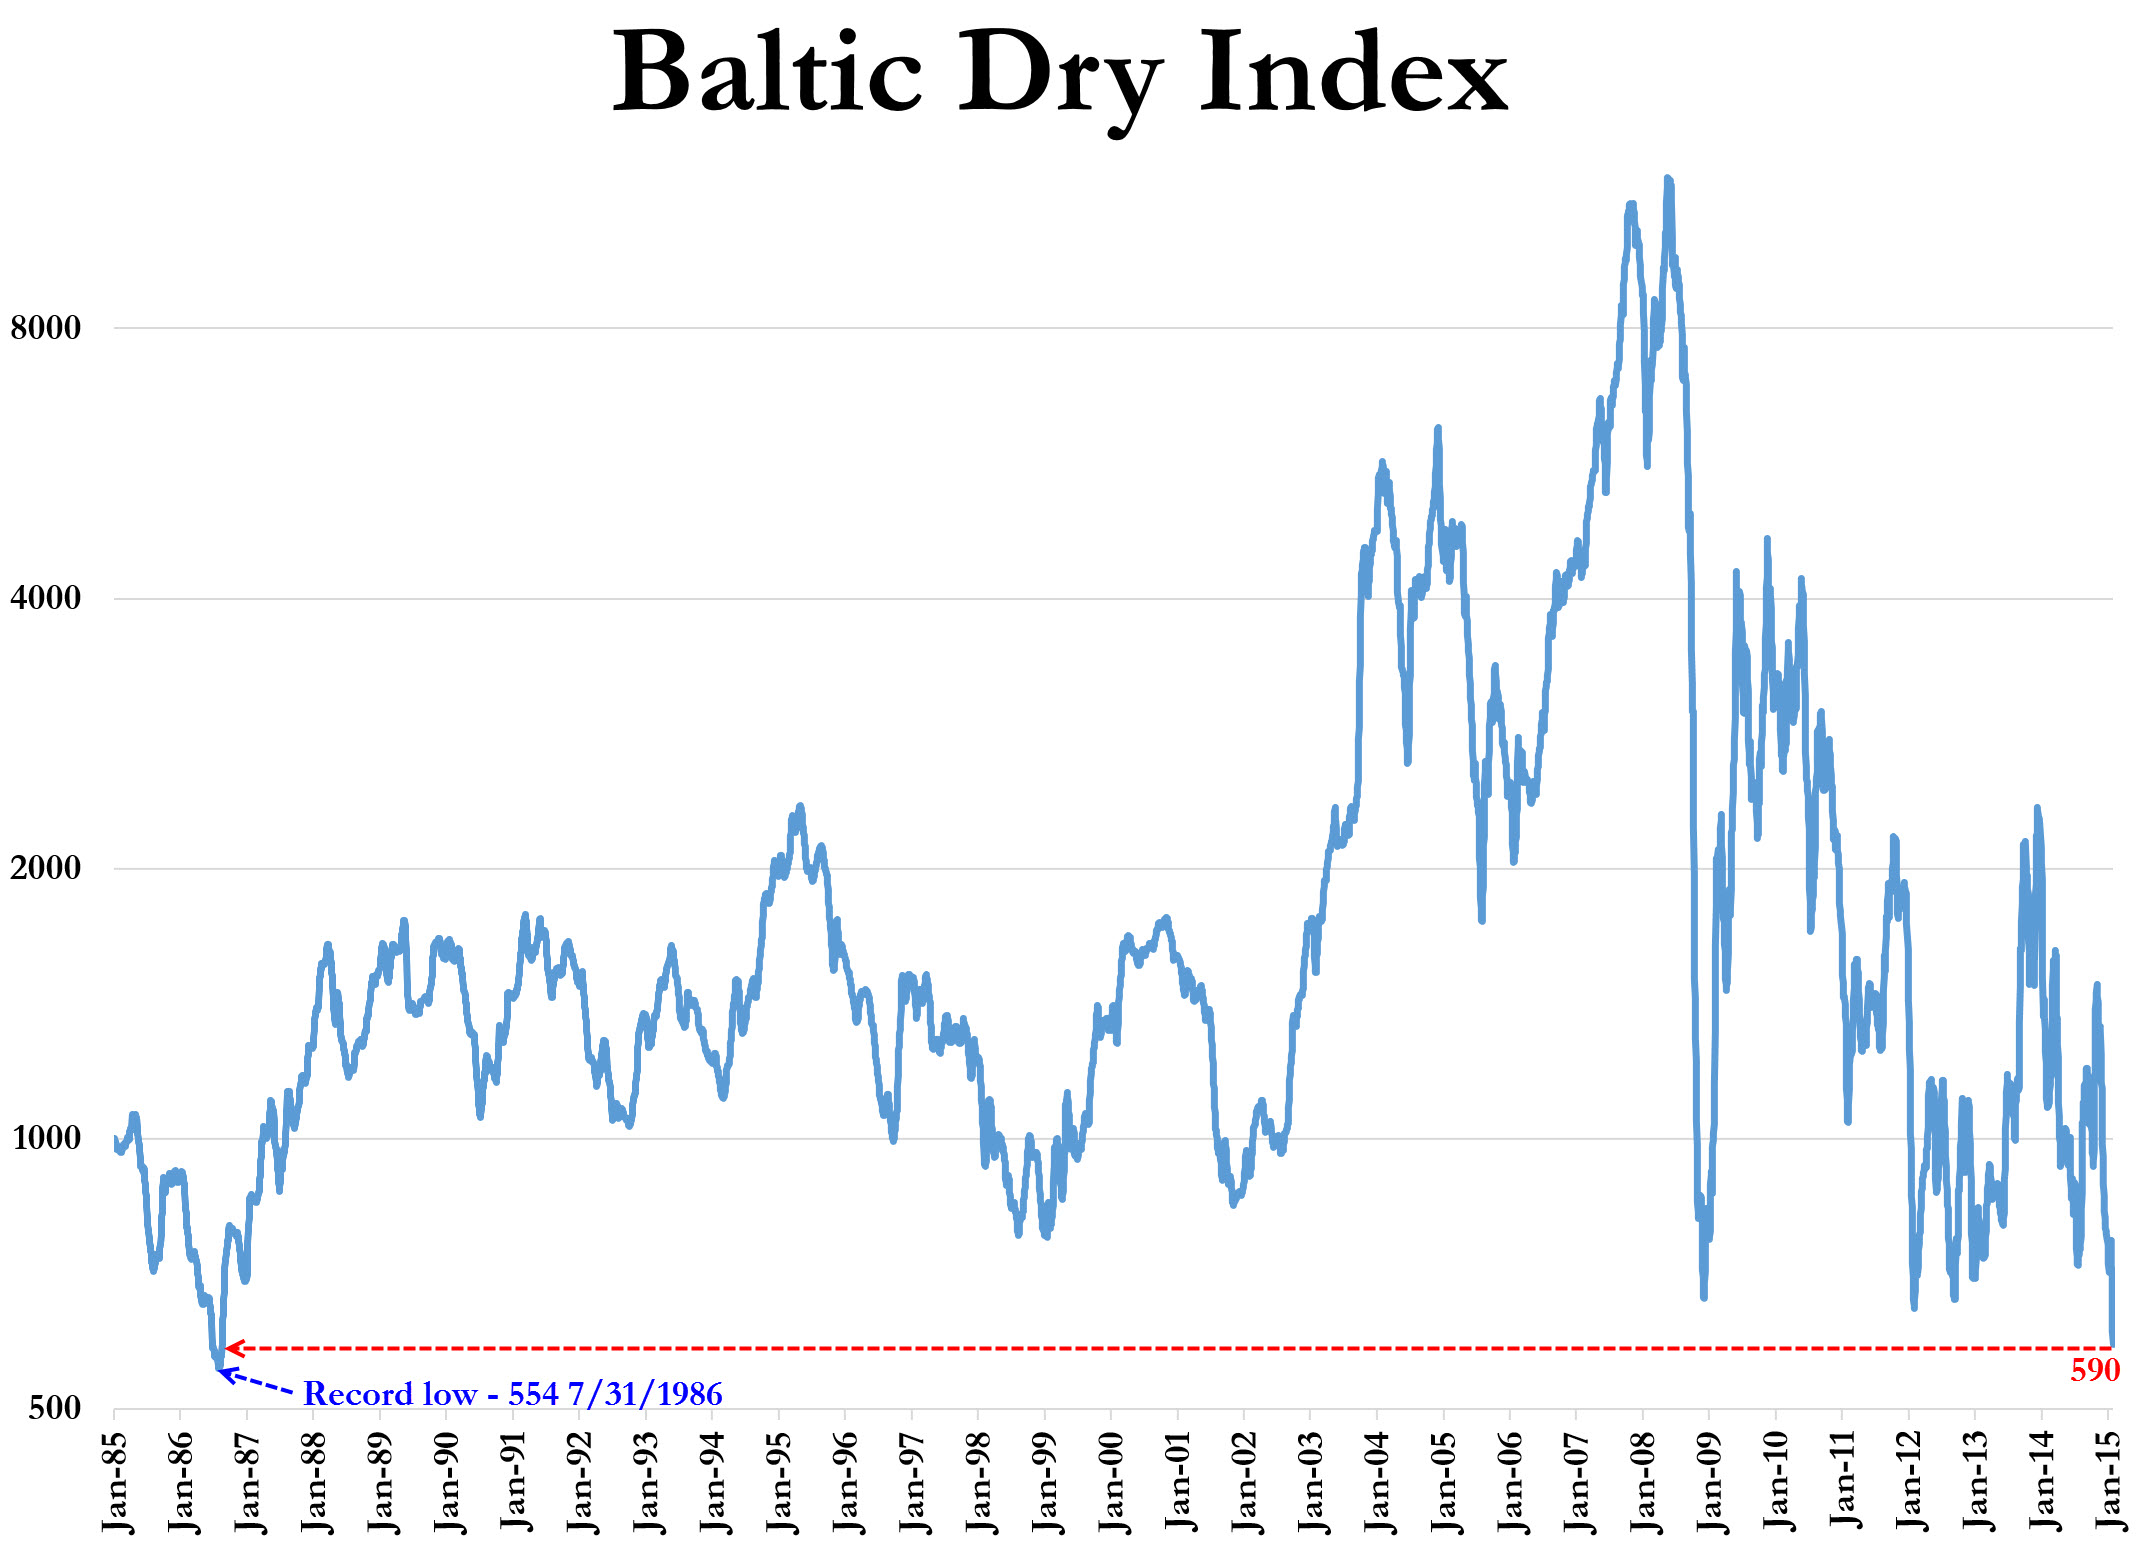
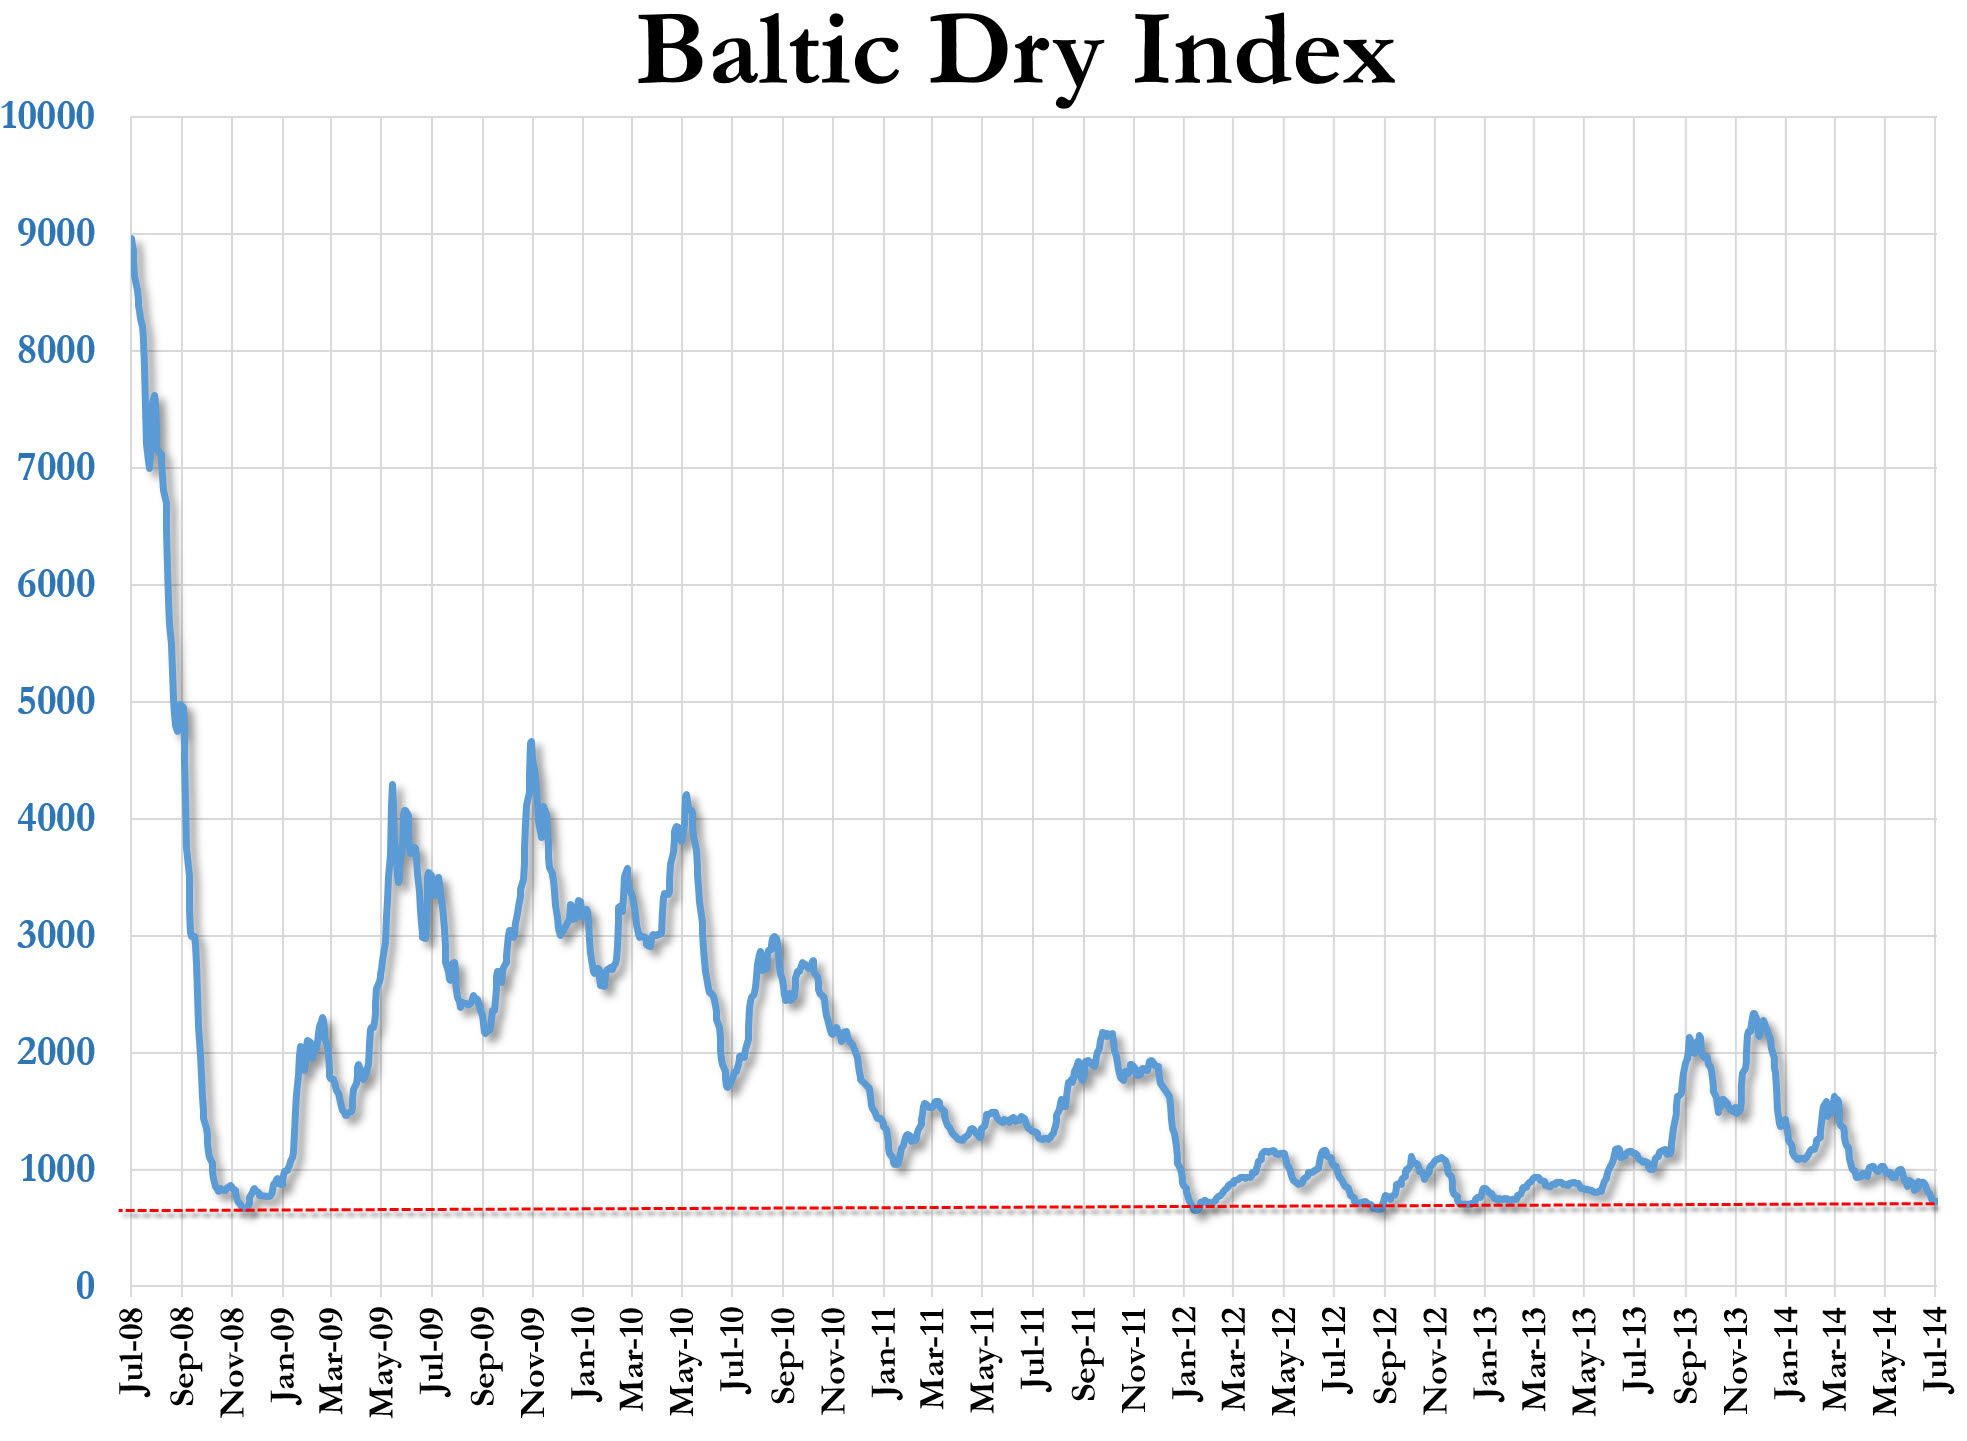
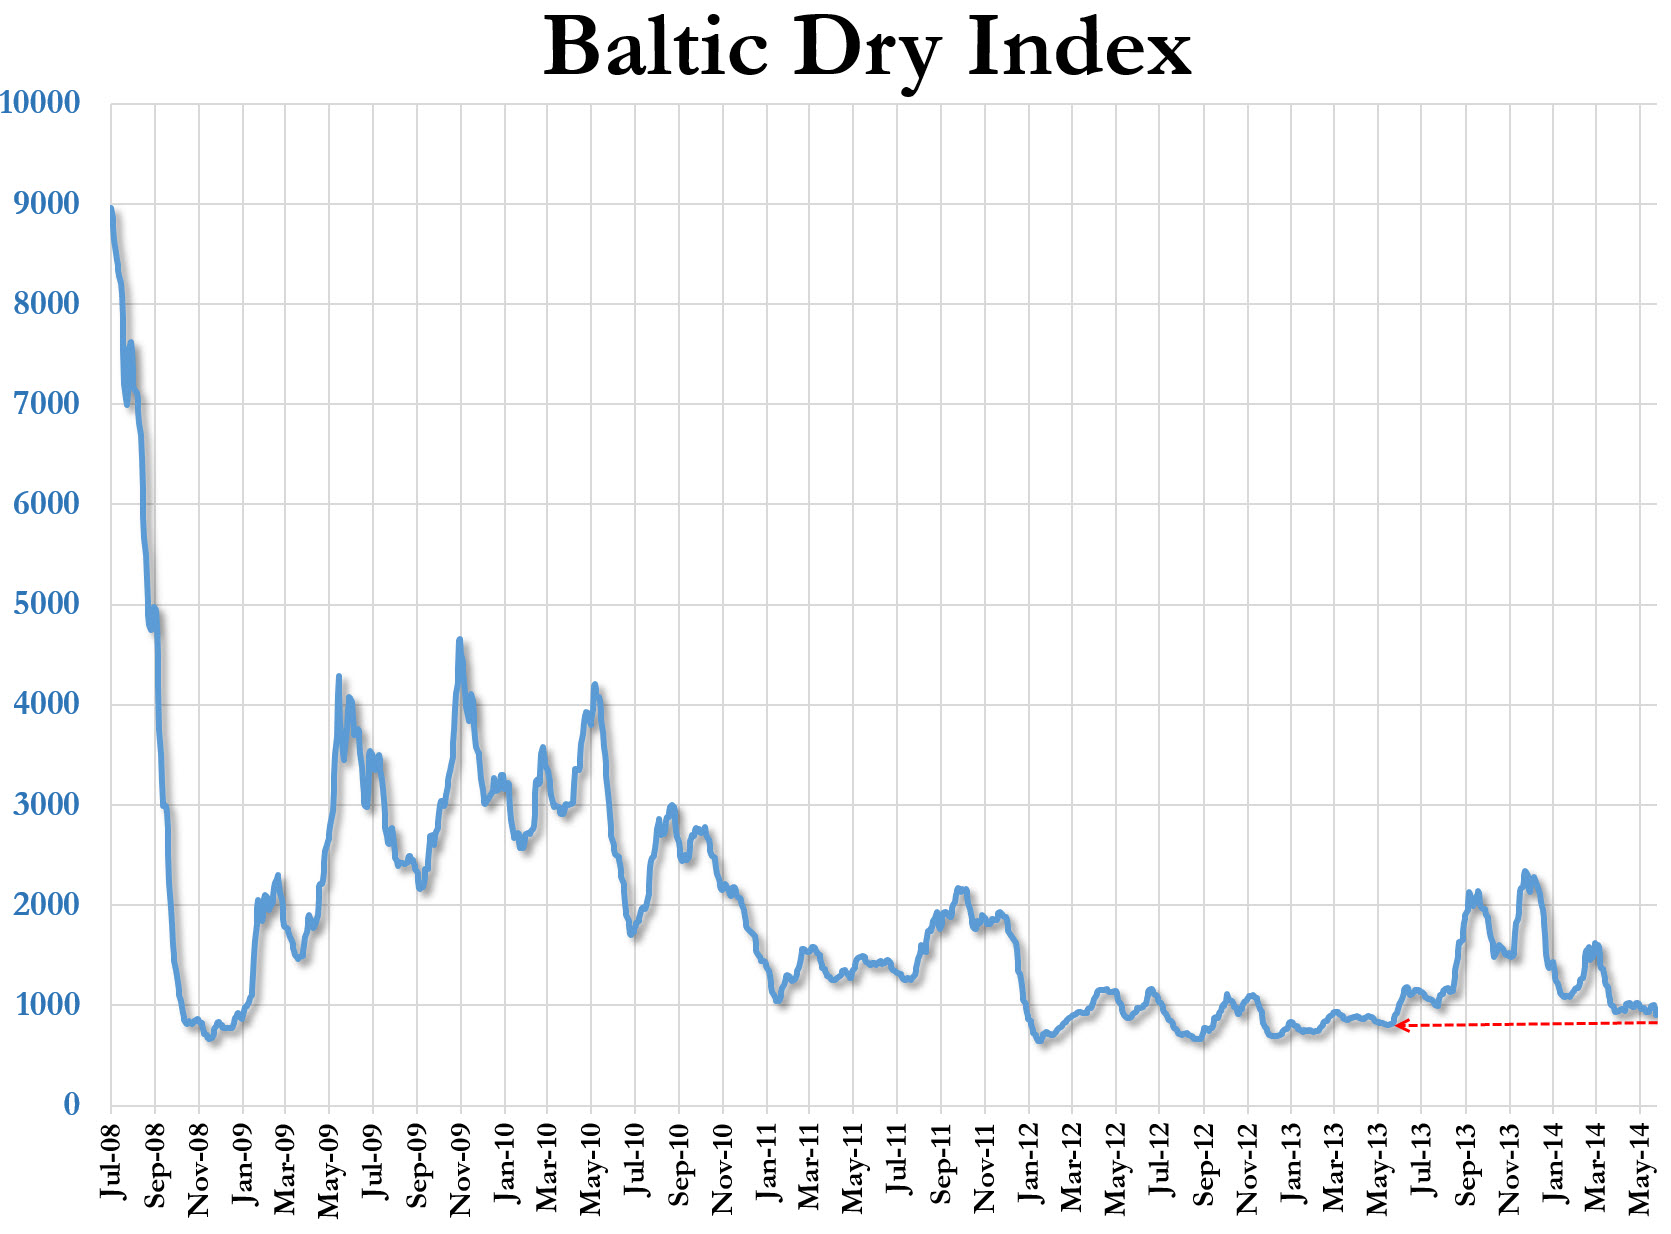
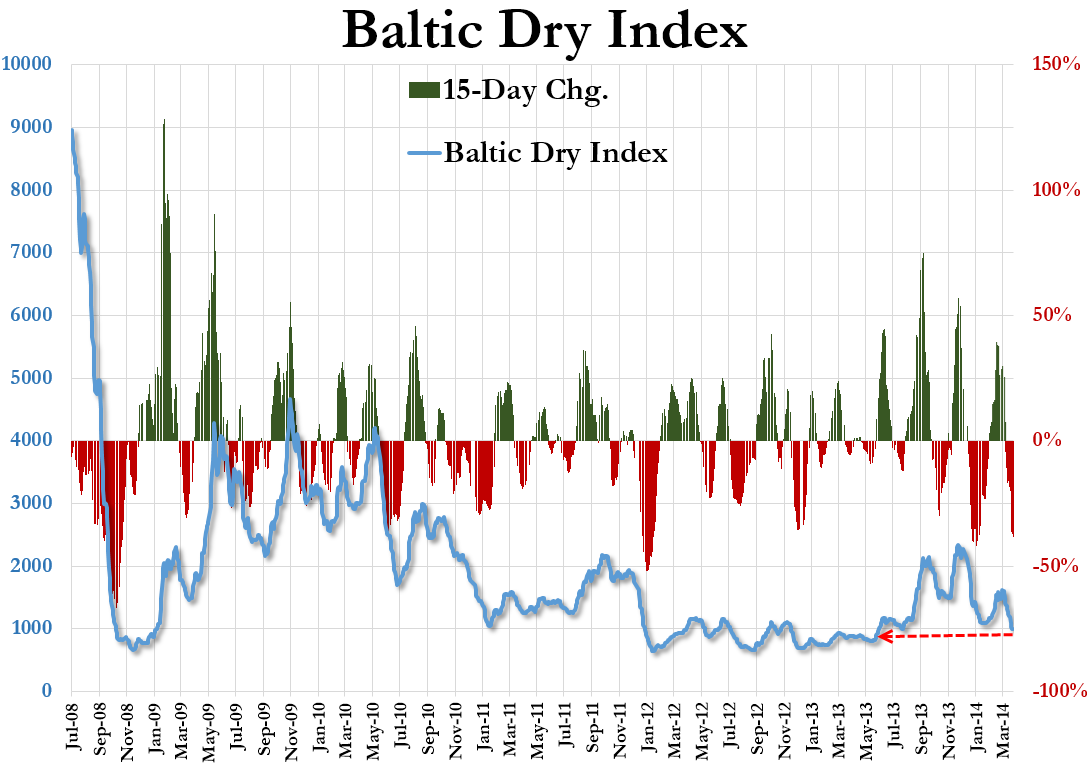
On Thursday the index stood at 564, close to the historic low level of 554 set in July 1986.

20150205_BDIY

As Reuters reports,

Privately-owned shipping company Copenship has filed for bankruptcy in Copenhagen after losses in the dry bulk market, its Chief Executive Michael Fenger told Reuters.

Read moreBulk Shipping Bankruptices Begin As Baltic Dry Collapse Continues

Baltic Dry Down 90% Of Days Since Cramer “Stressed Its Importance”; Crashes To New 29-Year Low

Baltic Dry Down 90% Of Days Since Cramer “Stressed Its Importance”; Crashes To New 29-Year Low (ZeroHedge, Feb 4, 2015):

And the collapse just keeps going… since Thanksgiving, The Baltic Dry has fallen on 43 or the 47 days, down over 60% from the “China growth is back and all-is-well” hope-filled days of late October (when Jim Cramer “stressed the importance of watching the Baltic Dry Freight Index,” as his bullish thesis confirmation). At 569, The Baltic Dry is inching ever closer to what will be the lowest level ever (554 on 7/31/1986) for the global shipping cost indicator…

One or two more days like this and it will be the all-time low…

BDIY-Collapse

Read moreBaltic Dry Down 90% Of Days Since Cramer “Stressed Its Importance”; Crashes To New 29-Year Low

Baltic Dry Plunges At Fastest Pace Since Lehman, Hits New 29 Year Low

Baltic Dry Plunges At Fastest Pace Since Lehman, Hits New 29 Year Low (ZeroHedge, Feb 2, 2015):

The Baltic Dry Index dropped another 3% today to 590 – its first time below 600 since 1986 and not far from the all-time record low of 554 in July 1986. Of course, the absolute level is shrugged off by the over-supply-ists and the ‘well fuel prices are down’-ists but the velocity of collapse (now over 60% in the last 3 months) suggests this far more than some ‘blip’ discrepancy between supply and demand – this is a structural convergence of massive mal-investment meets economic reality.

The Baltic Dry Index drops even more… new 29 year lows…

20150202_BDIY1

The fastest 3-month plunge since Lehman…

20150202_BDIY

Over-supply…

Read moreBaltic Dry Plunges At Fastest Pace Since Lehman, Hits New 29 Year Low

WTF Chart Of The Day: Baltic Dry Index Crashes To Lowest In 29 Years

WTF Chart Of The Day: Baltic Dry Index Crashes To Lowest In 29 Years (ZeroHedge, Jan 29, 2015):

Quietly behind the scenes – and not at all reflective of a collapsing global economy (because that would break the narrative of over-supply and pent-up demand) – The Baltic Dry Index plunged over 5% today to 632… That is the lowest absolute level for the global shipping rates indicator since August 1986

Baltic Dry Index_BDIY

“Transitory”

The Baltic Dry Index Has Never Crashed This Fast Post-Thanksgiving

The Baltic Dry Index Has Never Crashed This Fast Post-Thanksgiving (ZeroHedge, Dec 19, 2014):

We are sure it’s nothing – since stock markets in China and The US are soaring – but deep, deep down in the heart of the real economies, there is a problem. The Baltic Dry Index has fallen for 21 straight days, tumbling around 40% since Thanksgiving Day.  

Baltic-Dry-Index

This is the biggest collapse in the ‘trade’ indicator (which we should ignore unless it is rising) since records began 28 years ago…

Read moreThe Baltic Dry Index Has Never Crashed This Fast Post-Thanksgiving

The Baltic Dry Index Collapses To 18-Month Lows; Worst July Since 1986

The Baltic Dry Index Collapses To 18-Month Lows; Worst July Since 1986 (ZeroHedge, July 22, 2014):

The bulls will ignore it, shrugging that it’s merely over-supply of ships that the resurgent world economy will quickly soak up as it ‘recovers’… However, World GDP growth expectations are collapsing, trade volumes are slowing, and the Baltic Dry Index has continued to slump to its lowest since the start of January 2013 (a holiday period). For some context, this is the lowest July level for the Baltic Dry since 1986… “noise”

There’s this…

20140718_gdp

and then there’s this…

20140722_BDIY2

Which is the worst July level for the global shipping index since 1986…

Read moreThe Baltic Dry Index Collapses To 18-Month Lows; Worst July Since 1986

The Baltic Dry Index Is Having Its Worst Year Ever

The Baltic Dry Index Is Having Its Worst Year Ever (ZeroHedge, June 13, 2014):

At 906, the Baltic Dry Index slumped to 12-month lows showing absolutely no signs whatsoever of the Q2 renaissance in global growth that has been heralded by all the highly-paid meteoroconomists.

20140613_BDIY1

In fact, thanks to increasing fears over China’s commodity financing ponzi scheme, this is the worst year for the Baltic Dry on record.

Read moreThe Baltic Dry Index Is Having Its Worst Year Ever

Here’s Why The Baltic Dry Index Is Collapsing (In 1 Image)

–  Here’s Why The Baltic Dry Index Is Collapsing (In 1 Image) (ZeroHedge, May 14, 2014):

If ever there was a better indication of the mal-investment boom created by an interfering Fed, this is it. As demand for shipping collapses on real slowing in the global economy – markets have “told” shipbuilders to “build it and they will come”here is a ship-shipping ship, shipping shipping ships…

Here's Why The Baltic Dry Index Is Collapsing

Baltic Dry Index Drops For 15th Day To Lowest In 9 Months (Back Below $1000)

Baltic Dry Drops For 15th Day To Lowest In 9 Months (Back Below $1000) (ZeroHedge, April 14, 2014):

And still the mainstream media’s discussion of the collapse in the Baltic Dry shipping index is entirely absent. As we have been pointing out for weeks now, something extreme is occurring in the cost of shipping dry bulk around the world. 2014 is now witnessing the biggest drop in price (a typical seasonal pattern) to start the year since records began. Today’s drop to $989 (the first time below $1000 since June 2013) is the 15th drop in a row and it’s not just this index that is fading: Capesize, Panamax, and Supramax rates are all falling. As we noted previously, the shipbuilding industry is already feeling the pain.

20140414_bdiy

Shipbuilding Orders Evaporate As Baltic Dry Collapses

The Baltic Dry is down 14 days in a row at $1002 – its lowest in 8 months (and worst start to a year on record)

20140411_bdiy

Shipbuilding Orders Evaporate As Baltic Dry Collapses (Zerohedge, April 11, 2014):

The silence is deafening still about the ongoing collapse in the Baltic Dry Index among mainstream media types (as it just might challenge the hope/hype that growth is coming back). At the dismal level of 1002, BDIY is at 8-month lows and has fallen 14 days in a row… but now it is having a real world impact. As Sea News reports, Korean shipping companies are failing to place orders for large vessels and anxiety over the future is forcing some local companies to dispose of their assets despite the relatively low shipbuilding costs as of late.

Read moreShipbuilding Orders Evaporate As Baltic Dry Collapses

Baltic Dry Collapses To Worst Start To A Year On Record

Prepare for the greatest financial/economic collapse in (known) world history.


Baltic Dry Collapses To Worst Start To A Year On Record (ZeroHedge, April 9, 2014):

If you listen very carefully, you will still hear absolutely nothing from any talking-heads of the utter collapse that the last few weeks have witnessed in the Baltic Dry shipping index. The Baltic Dry has dropped 12 days in a row and plunged back to $1061 – its lowest since August 2013. This is the worst start to a year on record… must be the weather.

The Baltic Dry has dropped 12 days in a row and is now back to its lowest levels since August 2013… and almost post-crisis lows…

20140409_bdiy

Which is the worst start to a year since records began 30 years ago…

20140409_bdiy1_1

The last time we saw a year start like this was 2012 which saw massive concerted co-ordinated central bank easing in Q3 to save us all… it seems that is not coming anytime soon this time…

Data: Bloomberg

Baltic Dry Drops 9th Day In A Row; Worst Q1 In Over 10 Years

Baltic Dry Drops 9th Day In A Row; Worst Q1 In Over 10 Years (Zerohedge, April 5, 2014):

For a few weeks there, as the Baltic Dry Index rose, talking-heads were ignominous in their praise of the shipping index as a leading indicator of an awesome future ahead for the world economy. The last 9 days have smashed that ‘hope’ to smithereens (and yet the talking-heads have gone awkwardly silent, having moved on to some other bias-confirming meme). The Baltic Dry is down 25% in the last 2 weeks, back near post-crisis lows, and has just suffered the worst start to a year in over a decade. But apart from that, seems global trade is all-good and about to take off any minute now…

The worst start to a year in over a decade…

Read moreBaltic Dry Drops 9th Day In A Row; Worst Q1 In Over 10 Years

RECOVERY: Baltic Dry Plunges 8%, Near Most In 6 Years As Iron Ore At Chinese Ports Hits All Time High

See also:

China Is Crashing … As Predicted


Baltic Dry Plunges 8%, Near Most In 6 Years As Iron Ore At Chinese Ports Hits All Time High (ZeroHedge, March 12, 2014):

It would appear record inventories of Iron ore and plunging prices due to China’s shadow-banking unwind have started to weigh on the all-too-important-when-it-is-going-up-but-let’s-blame-supply-when-dropping Baltic Dry Index. With the worst start to a year in over a decade, the recent recovery in prices provided faint hope that the worst of the global trade collapse was over… however, today’s 8% plunge – on par with the biggest drops in the last 6 years – suggests things are far from self-sustaining. Still think we are insulated from the arcane China shadow-banking system, which suddenly everyone is an expert of suddenly? Think again.

Read moreRECOVERY: Baltic Dry Plunges 8%, Near Most In 6 Years As Iron Ore At Chinese Ports Hits All Time High

Baltic Dry Index Collapses 50% From December Highs To 5-Month Lows

Baltic Dry Index Collapses 50% From December Highs To 5-Month Lows (ZeroHedge, Jan 30, 2014)

We are sure it’s just a storm in a teacup; just a brief interlude before the IMF’s ever-changing forecast for global trade growth picks right back up again and demand to ship dry goods surges back to the inventory stuffed levels of Q4. But, for now, the Baltic Dry Index (admired when it’s rising, ignored when it drops) has collapsed by over 50% from its December highs and is back to August lows.

Baltic Dry Index Collapses

Charts: Bloomberg

Baltic Dry Index Collapses 39% In 9 Trading Days

Prepare for collapse.


Baltic Dry Index Collapses 39% In 9 Trading Days (ZeroHedge, Jan 15, 2014):

baltic-dry-index-collapse

The Baltic Dry Index,  a measure of commodity-shipping rates, has collapsed 39% in just the nine trading days of 2014. It has fallen from 2277 at the end of December 2013 to 1370 today. This key indicator of global economic health is a warning signal for the global economy in 2014.

Marc Faber told Bloomberg TV in an interview that, “I prefer physical gold and silver, platinum to bitcoin. How do you value a bitcoin? I can value gold to some extent and compare say gold to the quantity of money that is floating around the world, to the wealth increase, and to the monetary base increase, to the credit increase, and so forth and so on, and to the production costs. So I have an idea of where gold should be.”

A diversified precious metals portfolio with allocations to gold, silver, platinum and palladium remains prudent.

Baltic Dry Continues Collapse – Worst Slide Since Financial Crisis

Baltic Dry Continues Collapse – Worst Slide Since Financial Crisis (ZeroHedge, Jan 14, 2014):

Despite ‘blaming’ the drop in the cost of dry bulk shipping on Colombian coal restrictions, it seems increasingly clear that the 40% collapse in the Baltic Dry Index since the start of the year is more than just that. While this is the worst start to a year in over 30 years, the scale of this meltdown is only matched by the total devastation that occurred in Q3 2008. Of course, the mainstream media will continue to ignore this dour index until it decides to rise once again, but for now, 9 days in a row of plunging prices is yet another canary in the global trade coalmine and suggests what inventory stacking that occurred in Q3/4 2013 is anything but sustained.

Baltic Dry costs are the lowest in 4 months, down 40% for the start of the year, and the worst start to a year in over 30 years…

Baltic Dry Index-BDIY-Collapse

As we noted yesterday…

Of course, we are sure the ‘lead’ that the Baltic Dry seems to have over global macro will be quickly ignored…

Baltic Dry Index-BDIY-Collapse-2

Charts: Bloomberg

Baltic Dry Index Crashes 18% In 2 Days

Baltic Dry Index Crashes 18% In 2 Days (ZeroHedge, Jan 13, 2014):

We noted Friday that the much-heralded Baltic Dry Index has seen the worst start to the year in over 30 years. Today it got worse. At 1,395, the the Baltic Dry index, which reflects the daily charter rate for vessels carrying cargoes such as iron ore, coal and grain, is now down 18% in the last 2 days alone (biggest drop in 6 years), back at 4-month lows. The shipping index has utterly collapsed over 40% in the last 2 weeks. We are sure this is just a storm in a teacup and that all the hopes and prayers of a global manufacturing renaissance will come true. Cue, “this is not a demand issue, it’s an over-capacity issue” excuses in 3…2…1… now where would the container ships get their idea to increase capacity? (hint: central planner-based mal-investment)

Baltic-Dry-Index-BDIY

Of course, we are sure the ‘lead’ that the Baltic Dry seems to have over global macro will be quickly ignored…

Baltic-Dry-Index-BDIY-BDIY1

On potential driver of the price plunge is Colombia’s tougher stance on coal exports (via The FT):

Read moreBaltic Dry Index Crashes 18% In 2 Days

Baltic Dry Index Collapses 35% – Worst Start To Year In 30 Years

Prepare for collapse.


Baltic Dry Index Collapses 35% – Worst Start To Year In 30 Years (ZeroHedge, Jan 10, 2014):

When this indicator of global trade rises, everything is rosy and reams of asset-gatherers and talking-heads wil quote it as indicative of how great the world is. When it drops – silence. There’s always an excuse – over- or under-capacity, too many ships, too few ships, etc. However, the last 2 weeks have seen a 35% collapse in the cost to ship bulk. There is a relative seasonal pattern over the holiday period – with shipping costs rising into the holiday and falling after but… this is the biggest drop from a Christmas Eve since at least 1984, 30 years! Seems like the inventory stacking of Q4 had absolutely no follow-through whatsoever…

All thepost-Thanksgiving exuberance has been eviscerated from the Baltic Dry Index…

20140109_BDIY2

and some context – this is the worst post-holiday start to the year since at least 1984!!

Read moreBaltic Dry Index Collapses 35% – Worst Start To Year In 30 Years

Recovery: Baltic Dry ‘Bear Market’ Index

Baltic Dry Bear Market Index (ZeroHedge, Oct 24, 2013):

As much as we loathe saying “we told you so” – especially when it relates to highlighting the fallacious bullshit of one James Cramer – the truth is that just 3 weeks ago we pointed out the fact that the Baltic Dry Index was being heralded as proof of China’s (and therefore the world’s great recovery) was a mistake. At the time, we noted the temporary nature of the move and now forward markets indicated it was not sustainable; and of course, were met with a chorus of deniers. Well, following a 4.4% decline today, the Baltic Dry Index has now plunged over 20% from its recent peak (and the more crucial Capesize container rates even more) as underlying demand simply cannot keep pace with the massive (overbuilt) ship glut that remains. Added to this is the apparent ‘tightening’ stance by the PBOC that we have been noting and we suspect, as we warned, the 2011 deja vus will be clear.

Chart: Bloomberg

22 Reasons To Be Concerned About The U.S. Economy As We Head Into The Holiday Season

22 Reasons To Be Concerned About The U.S. Economy As We Head Into The Holiday Season (Economic Collapse, Oct 14, 2013):

Are we on the verge of another major economic downturn?  In recent weeks, most of the focus has been on our politicians in Washington, but there are lots of other reasons to be deeply alarmed about the economy as well.  Economic confidence is down, retail sales figures are disappointing, job cuts are up, and American consumers are deeply struggling.  Even if our politicians do everything right, there would still be a significant chance that we could be heading into tough economic times in the coming months.  Our economy has been in decline for a very long time, and that decline appears to be accelerating.  There aren’t enough jobs, the quality of our jobs continues to decline, our economic infrastructure is being systematically gutted, and poverty has been absolutely exploding.  Things have gotten so bad that former President Jimmy Carter says that the middle class of today resembles those that were living in poverty when he was in the White House.  But this process has been happening so gradually that most Americans don’t even realize what has happened.  Our economy is being fundamentally transformed, and the pace of our decline is picking up speed.

The following are 22 reasons to be concerned about the U.S. economy as we head into the holiday season:

Read more22 Reasons To Be Concerned About The U.S. Economy As We Head Into The Holiday Season

The U.S. Economy Is Now Dangerously Detached From Reality

From the article:

“The downturn in consumption and industry also seems to be supported by the Baltic Dry Index, a measure of global shipping and rates.  The BDI has fallen to near historic lows THREE TIMES in the past year, which to my knowledge, has never happened before.  In the past, the BDI has been a strong prophetic indicator of future market volatility.  Usually, around a year after a severe decline in the index, a dangerous economic event takes place.  The BDI made its first sharp drop to all time lows at the end of January 2012, exactly a year ago.”


The U.S. Economy Is Now Dangerously Detached From Reality (Alt-Market, Feb 8, 2013):

Recently I was asked to give a presentation on the current state of the global economy to a local group of concerned citizens here in Northwest Montana.  I was happy to oblige but when composing my bullet points I realized that, in truth, there were no legitimate economic numbers to examine anymore.  You see, financial analysts have traditionally used multiple indicators of employment, profit, savings, credit, supply, and demand in their efforts to divine the often obscured facts of our financial system.  The problem is, nearly every index we used in the past, every measure of capital flow and industry, is absolutely useless today.

We now live in an entirely fabricated fiscal environment.  Every aspect of it is filtered, muddled, molded, and manipulated before our eyes ever get to study the stats.  The metaphor may be overused, but our economic system has become an absolute “matrix”.  All that we see and hear has been homogenized and all truth has been sterilized away.  There is nothing to investigate anymore.  It is like awaking in the middle of a vast and hallucinatory live action theater production, complete with performers, props, and sound effects, all designed to confuse us and do us harm.  In the end, trying to make sense of the illusion is a waste of time.  All we can do is look for the exits…

Read moreThe U.S. Economy Is Now Dangerously Detached From Reality

The Baltic Dry Index Slumped 60 Percent Last Year!

From Bloomberg, Jan 8, 2013:

The glut in Panamaxes extends across the fleet. The Baltic Dry Index, a measure of rates for four classes of dry-bulk commodity carriers, slumped 60 percent last year. The Baltic Dirty Tanker Index of oil-shipping rates retreated 18 percent and a measure of charges for six types of containers declined 14 percent, according to the Hamburg Shipbrokers’ Association.

Shipping Rates Go … Negative!

Shipping Rates Go… Negative (ZeroHedge, Feb. 6, 2012):

Following the endless collapse in the Baltic Dry, it was only a matter of time before the shipping industry one-upped the Chairsatan, and was the first to introduce, dum dum dum, negative rates. That’s right: you are now paid to hire a ship. Via Bloomberg:

  • GLENCORE HIRES SHIP AT MINUS $2,000 A DAY, GMI SAYS
  • GMI TO CONTRIBUTE $2,000 A DAY TO GLENCORE’S FUEL COSTS
  • GLOBAL MARITIME’S U.K. MD STEVE RODLEY CONFIRMS DEAL BY PHONE

Why is this happening? Perhaps because ships have to be kept seaworthy and in motion or else they become scrappage in as little time as 3 months. Think sharks. Needless to say, this will play havoc with shipping company (and affiliated entities’) liquidity, as the biggest default wave in the history of the industry is about to be unleashed and tens if not hundreds of billions of European secured loans are about to be “impaired.”

RED ALERT: The Baltic Dry Index Continues To CRASH, Hits RECORD LOW, Falls For 34th Consecutive Session To 647

See also:

RED ALERT: Baltic Dry Index Continues To CRASH! (Jan. 30, 2012)

And opinions like this one from economist Dennis Gartman

The Irrelevance Of The Baltic Freight Index

… are – in my opinion – only ‘partially’ correct.

Compare this:

(Dec. 13, 2011): Business Week — Gold is in the “beginnings of a real bear market,” economist Dennis Gartman said today in his daily Gartman Letter.

.. to this …

– (Jan. 31, 2012): Silver Surges 21 Percent in January, Demand Is ‘Diminishing A Supply Surplus’:

Dennis Gartman, economist and newsletter writer, said he is buying more gold priced in euros after he “returned to this trade” last week. It is “time to add to the trade and we are doing so this morning,” he said today in his daily Gartman Letter.

Looks like he ‘knows’ what he talking about! He sounds like the Mitt Romney of economists!

Gold and silver (‘usually’) bottom out around (‘directly after’) Christmas.

The sheeple buy iPads and iPhones and we buy gold and silver!

Prepare for collapse!


Global Shipping Prices Face More Choppy Waters (Wall Street Journal, Feb. 2, 2012)

Times are tough for the shipping market.

Freight rates hit a record low Wednesday on weak demand for iron ore, poor weather conditions in mining regions and a glut of shipping capacity. The Baltic Dry Index, a composite of commodity shipping costs around the world, fell for a 32nd consecutive session to 662. The previous low, of 663, came in December 2008, during the depths of the credit crunch.

But unlike three years ago, this slump reflects more than a sluggish global economy. A conflation of seasonal, environmental and demand-side factors has accelerated the index’s decline in recent months and could tip it further into the red. The index has plunged 59% this year alone and is down 94% from the peak hit just before the crisis hit.

Read moreRED ALERT: The Baltic Dry Index Continues To CRASH, Hits RECORD LOW, Falls For 34th Consecutive Session To 647

RED ALERT: Baltic Dry Index Continues To CRASH! (Jan. 30, 2012)

The BDI is plummeting (and is going down faster than the Titanic) and will soon hit record lows.

Compare past market crashes and economic turmoil to the BDI and to no surprise you’ll find that there is more than just a ‘correlation’.

Shipping rates never recovered from the 2008 collapse and in just one month the BDI crashed from 1600 to 702, or more than 66%!

Soon everything will come to a standstill, AGAIN. But this time it will be worse, much worse than 2008.

One just has to look at the $1600 trillion (estimated notional value of the worldwide derivatives market) derivative tsunami versus  $60 trillion of  world GDP to get ‘a little concerned’.

Here is a ‘good’ example:

Accordingly, it sure is a good thing that the world’s biggest derivatives player – J.P. Morgan – has ‘seemingly’ NEVER, EVER made a bet even ’1 % wrong’ with their 80 Trillion derivatives book. The Morgue has a Market Cap of roughly $180 billion. A wrong bet of a mere 1% on their ‘book’ would translate to a loss of $800 billion dollars eviscerating their entire capital base more than four times over. The knock on effect from such an event would trigger multiple tsunamis reverberating through the global financial system. Sounds absurd, but it’s pure math.

And knowing that this is just one piece of the puzzle, it’s safe to say that not one stone will be left upon another.

The greatest financial collapse in world history is coming! (Maybe not right now, but soon enough!)

Got gold, silver, food, water, full survival gear etc.?

Prepare for collapse!

Source: Bloomberg