– Central Banks Have Purchased $2 Trillion In Assets In 2017:
In his latest “flow report”, BofA’s Michael Hartnett looks at the “Disconnect Myth” between rising stocks and bonds and summarizes succinctly that there is “no disconnect between stocks & bonds.”
Why? The best, and simplest, explanation for low yields & high stocks is simple: so far in 2017 there has been $1.96 trillion of central bank purchases of financial assets in 2017 alone, as central bank balance sheets have grown by $11.26 trillion since Lehman to $15.6 trillion. Hartnett concedes that the second best explanation is bonds pricing in low CPI (increasingly a new structurally low level of inflation due to tech disruption of labor force) while equities price in high EPS (with little on horizon to meaningfully reverse trend), although there is no reason why the second can’t flow from the first.
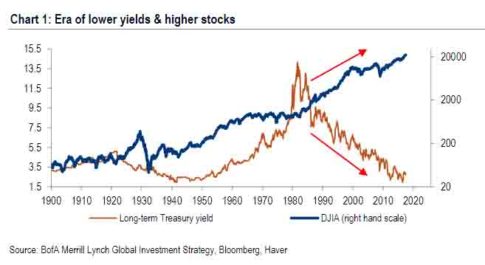
The result is an era of lower yields & higher stocks, or as the chart below shows, an era in which the alligator jaws of death are just waiting for their moment to shine. Here are the three phases:
- 1981-2009 (disinflation/Fed put), 10-year Treasury yields down from 15.8% to 3.9% = 10.7% annualized S&P 500 returns;
- 2009-2016 (Fed QE/global ZIRP) yields down from 3.9% to 2.4% = 14.9% SPX ann. return;
- 2017 YTD (ECB/BoJ QE) yield down to 2%, SPX annualizing 17.5%.
BofA then gives a list of how to time the endgame, or when bonds become bad for stocks:
- yield curve inverts,
- lower yields lead to higher credit spreads (particularly high yield & EM bond spreads…watch tech spreads in coming months),
- The deflation bonds discounting starts to negatively impact EPS,
- flip side is never good sign to see rising yields coincide with falling bank & housing stocks;
The good news is that none of these 4 conditions are being met, for now.
Some other observations from BofA, which points out this week’s ZIRPy Flows:
- markets now see Sep’18 as earliest FOMC with >50% chance of Fed hike;
- 2-10-year UST yield curve at 78bps (3bps from 9-year lows);
- US IG & HY bonds at highs;
- 4 straight weeks of outflows from floating-rate bank loan funds (after 31 straight weeks of inflows post-Trump);
- IG on pace for record year of inflows ($179bn YTD);
- biggest inflows to Treasury funds in 61 weeks (most since Brexit).
Putting these together, signal that consensus is once again discounting the “Japanification” of Wall Street.
Speaking of flows this week, $6.6bn went into bonds, $3.7bn into equities, and $1.3bn into gold. Speaking of the latter, this was the biggest inflows in 30 weeks as XAU pushing gold to the highest in 1 year, and the USD to the lowest since Jan’15.
One thing still hasn’t changed though: BTD, or investors still buying each and every risk dip. Tuesday saw largest daily inflow to equities ($5.1bn – mostly US & Japan) in 6 weeks on day SPX down 0.8% on North Korea/Irma. One day, Buy-The-Dip will spectacularly stop working, but until then…
* * *
PayPal: Donate in USD
PayPal: Donate in EUR
PayPal: Donate in GBP
