“93 million: the number of people who don’t work, and don’t want work.
To put some context around that last number, it is 30% of the entire U.S. population.”
– Why Do So Many Working Age Americans Choose Not To Enter The Workforce? (ZeroHedge, July 30, 2015):
Via ConvergEx’s Nick Colas,
Today we look at a unique dataset – Gallup’s annual poll of job satisfaction – to see what it can tell us about secular trends in employment, consumer confidence and spending. This annual survey of +1,000 people active in the U.S. workforce goes back to the late 1980s, so it is a useful lens with which to consider issues like labor force participation rates that have shifted unexpectedly over the period.
Most surprising news first: Americans express a broad satisfaction with their jobs, regardless of economic conditions. The very worst reading since 1989 was in 2011 when “Only” 83% of respondents said they were either “Somewhat” or “completely” satisfied with their jobs. The peak was in 2007 at 94%, and last year (August 2014) it was 89%.
The key takeaway is that declining labor force participation rates since the year 2000 (67% then, 62.6% now) aren’t because of any systemic disaffection with the American workplace.
The other notable takeaway: workers are (strangely, we must say) satisfied with what they earn. Those expressing “Complete” satisfaction with their paystub hit a high last year (31%) not seen since 2010 and 2006… Wage inflation? What for?
You could call it the “Mystery of the Missing Worker” – why do so many people of working age chose not to enter the workforce? Here are the numbers, as of the most recent Employment Situation report:
- 250 million: the total number of people of working age in the United States.
- 149 million: the total number of people in that population that have a job.
- 8 million: the number of people who want a job but do not have one.
- 93 million: the number of people who don’t work, and don’t want work.
To put some context around that last number, it is 30% of the entire U.S. population. This is the same as the current population of the entire West Coast (CA, OR, and WA) AND New York State AND Florida. Plus another 10 million people. Economists measure this with the Labor Force Participation rate, and it has been in decline since February 2000, when it peaked at 67.3%. It is now 62.6% and last month was a new low back to the 1970s. People of working age increasingly do not consider themselves part of the labor force. Most economists chalk this up to the demographics of an aging workforce even though virtually all the literature on the topic in the early 2000 predicted participation would continue to increase.
We recently took a long look at a dataset that doesn’t often see the light of day but does provide some useful takes on how workers view their jobs. It comes from the Gallup organization and is an annual survey of +1,000 employees since 1989 on their perceptions of job satisfaction in all its forms, from health and safety concerns to compensation to job security. The complete data set can be found here, and the charts below highight the trends…
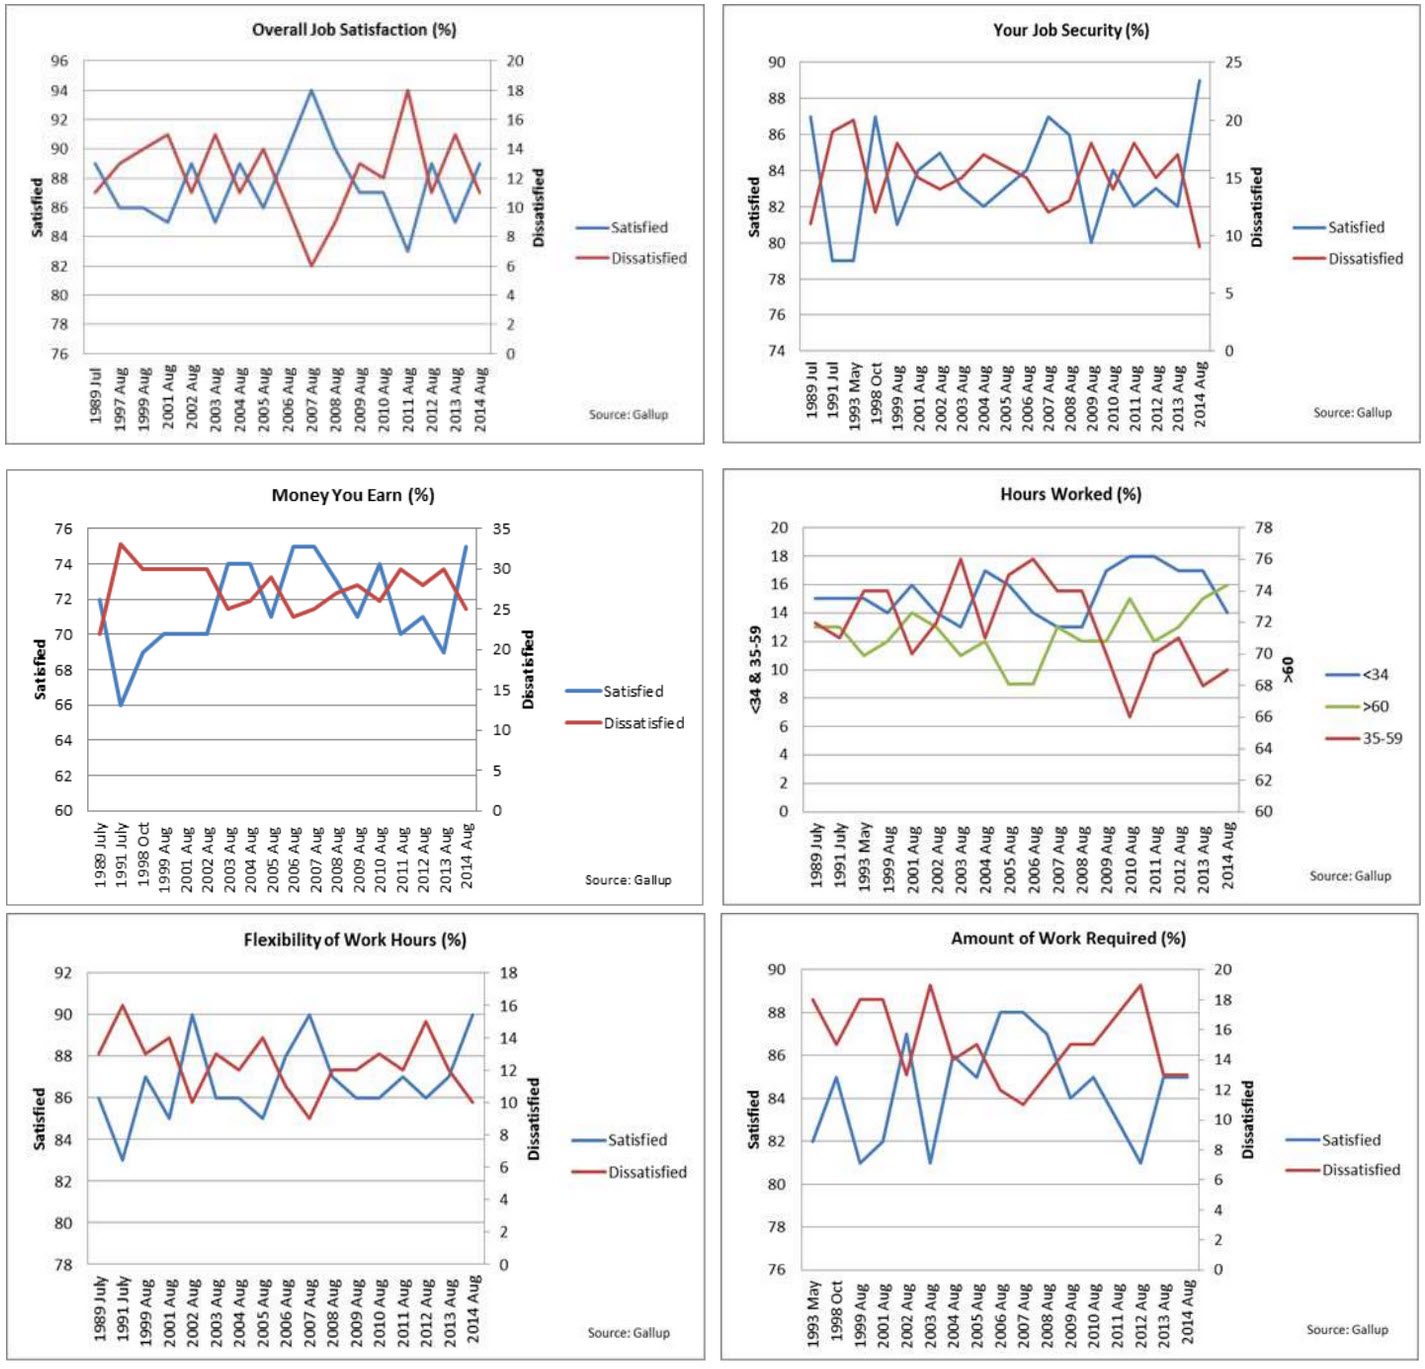
But here are the important takeaways.
#1: Americans are consistently satisfied with their jobs, although the readings vary slightly through a given economic cycle. The highest ever combined responses of “Completely Satisfied” and “Satisfied” was in 2007 at 94%. The worst since the start of the survey in the late 1980s was 2011, at 82%. Last year – the results come out every August – the combined reading was 58% “Completely” and 31% “Somewhat” Satisfied, for a total of 89%.
#2: They also feel relatively secure in their positions. Last year some 88% reported being “Completely” (58%) or “Somewhat” (31%) satisfied by the security offered by their jobs and, implicitly, their employers. The worst readings were in 2009 at 80% total and in the early 1990s at 79%.
#3: Workers also report high levels of satisfaction with what they receive in terms of compensation. Back in 1991 – the worst year in terms of general reported satisfaction for this question – “only” 66% of respondents were completely or somewhat satisfied with their pay stubs. Even during the Financial Crisis and its aftermath that number troughed at 70% in 2011. Last year a total of 75% of respondents were satisfied with what they received for compensation.
#4: Workers who respond to the Gallup survey last year have the biggest gripes about health insurance benefits (only 61% satisfied), retirement planning (only 63% satisfied) and chances for promotion (68%).
#5: Conversely, workers reported exceptionally high levels of satisfaction in their relations with co-workers (95% completely or somewhat satisfied), physical safety (93%) and the flexibility of their hours (90%).
Frankly, when we started to look at these numbers we expected to see a mirror of the volatility common in consumer confidence surveys. A few points here:
- Consumer confidence as measured by the Conference Board peaked in 1966/67 and again in the late 1990s at readings of +140.
- Troughs occurred in the early 1970s, late 1970s/early 1980s and post September 11 at readings of 50 or so.
- The Financial Crisis took us down to below 30 in 2008 and readings struggled to get past 70 until 2013.
We therefore thought that Americans would feel broadly the same about their work situations as they did the economy as a whole – that things are still pretty bad and the past was much better than the present. This turned out not to be the case. Yes, they express some marginal disaffection when times are hard, but the trough reading during and after the Financial Crisis was 83% satisfied with their jobs. Hardly a pitchforks and barricades kind of number.
In short, we can’t blame lower participation rates on the nature of work – broadly speaking – offered in the American economy. In Internet parlance, the American workplace gets 4 ½ stars and a lot of recommendations. Perhaps, in the words of Yogi Berra: “No one goes to that restaurant any more. It’s too crowded”.
* * *
Of course, when work is punished in the Entitlement State Americans live in… what else should we expect but 30% of the employable to sit at home? As we previously explained,
This is the painful reality in America: for increasingly more it is now more lucrative – in the form of actual disposable income – to sit, do nothing, and collect various welfare entitlements, than to work.
This is graphically, and very painfully confirmed, in the below chart from Gary Alexander, Secretary of Public Welfare, Commonwealth of Pennsylvania (a state best known for its broke capital Harrisburg). As quantitied, and explained by Alexander, “the single mom is better off earnings gross income of $29,000 with $57,327 in net income & benefits than to earn gross income of $69,000 with net income and benefits of $57,045.“
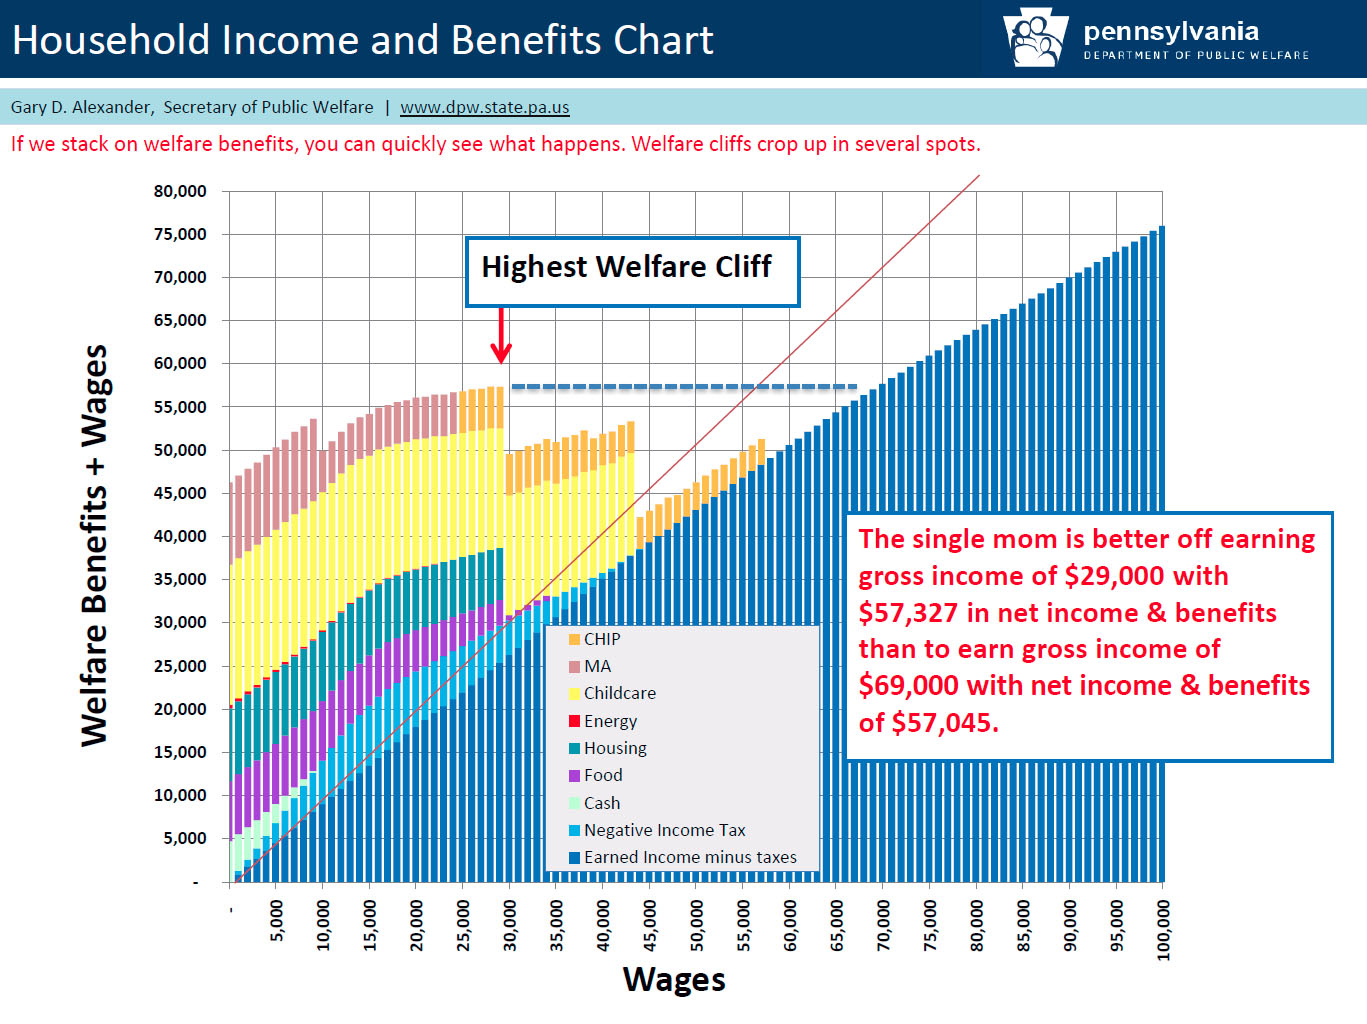
We realize that this is a painful topic in a country in which the issue of welfare benefits, and cutting (or not) the spending side of the fiscal cliff, have become the two most sensitive social topics. Alas, none of that changes the matrix of incentives for most Americans who find themselves in a comparable situation: either being on the left side of minimum US wage, and relying on benefits, or move to the right side at far greater personal investment of work, and energy, and… have the same disposable income at the end of the day.
What total horse pucky! The language used is enough to tell one this was staged to satisfy greedy gut corporate employers. Gallop, just like all the other American institutions, has sold out to the highest bidder.
People benefit by sitting home and collecting workfare? I cannot believe my eyes. I worked in employment for 30 years, and that is total rubbish. Yeah, much better to live on food stamps than to be able to buy your own groceries…..that really adds to quality of life. Food stamps cover about half the food users consume in a month, if they are very careful.
Oh, yes, there are so many government programs to feed the hungry and house the homeless…..Homeless people are free by this bullshit report…….how offensive.
Out of over 200 million working age Americans 93.6 MILLION are suffering long term unemployment. So much more fun to struggle to keep a roof over one’s head than to have a job…….What total blather. We have real unemployment at nearly 50%. Our mendacious leaders insist we are in a recovery and that unemployment is now at 5.2%…….. Lie after lie after lie.
I guess these lies make it okay to ignore the hungry, homeless and sick…….The right wing bastards who authored this crap ought to be called out in public……
This is the most offensive and propaganda fueled article I have ever read. Gallop is now as corrupt as our leaders……The US has lost all credibility and all decency.
Ignoring the homeless and the hungry is what fueled the French Revolution…….It is a fool thing to do.
Sickening.