And yes, you can’t make this stuff up!!!

‘The Earth’s recent temperatures rank in the lowest 3 per cent of all those recorded since the end of the last ice age’
– “Hottest Year On Record?” Think Again! Meet ‘Seasonally-Adjusted’ Seasons (ZeroHedge, Feb 1, 2015):
Day after day in modern macro-economics, investors are bombarded with ‘odd’ seasonal adjustments that spuriously lift (in the case of growth-related variables) or reduce (in the case of inflation-related variables) data to ensure a constant flow of “we must keep offering free/cheap money” narrative-confirming news.
However, as The Telegraph reports, it appears this “seasonal adjustment” smoke-screen has reached the just as bifurcated opinioned world of global warming trends and Climate-Gate…
Although it has been emerging for seven years or more, one of the most extraordinary scandals of our time has never hit the headlines. Yet another little example of it lately caught my eye when, in the wake of those excited claims that 2014 was “the hottest year on record”, I saw the headline on a climate blog: “Massive tampering with temperatures in South America”. The evidence on Notalotofpeopleknowthat, uncovered by Paul Homewood, was indeed striking.
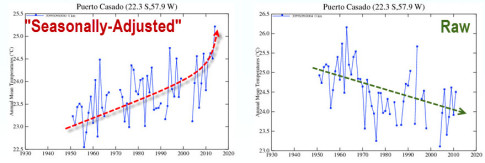
Puzzled by those “2014 hottest ever” claims, which were led by the most quoted of all the five official global temperature records – Nasa’s Goddard Institute for Space Studies (Giss) – Homewood examined a place in the world where Giss was showing temperatures to have risen faster than almost anywhere else: a large chunk of South America stretching from Brazil to Paraguay.
Noting that weather stations there were thin on the ground, he decided to focus on three rural stations covering a huge area of Paraguay. Giss showed it as having recorded, between 1950 and 2014, a particularly steep temperature rise of more than 1.5C: twice the accepted global increase for the whole of the 20th century.
But when Homewood was then able to check Giss’s figures against the original data from which they were derived, he found that they had been altered. Far from the new graph showing any rise, it showed temperatures in fact having declined over those 65 years by a full degree. When he did the same for the other two stations, he found the same. In each case, the original data showed not a rise but a decline.
Homewood had in fact uncovered yet another example of the thousands of pieces of evidence coming to light in recent years that show that something very odd has been going on with the temperature data relied on by the world’s scientists. And in particular by the UN’s Intergovernmental Panel on Climate Change (IPCC), which has driven the greatest and most costly scare in history: the belief that the world is in the grip of an unprecedented warming.
How have we come to be told that global temperatures have suddenly taken a great leap upwards to their highest level in 1,000 years? In fact, it has been no greater than their upward leaps between 1860 and 1880, and 1910 and 1940, as part of that gradual natural warming since the world emerged from its centuries-long “Little Ice Age” around 200 years ago.
This belief has rested entirely on five official data records. Three of these are based on measurements taken on the Earth’s surface, versions of which are then compiled by Giss, by the US National Oceanic and Atmospheric Administration (NOAA) and by the University of East Anglia’s Climatic Research Unit working with the Hadley Centre for Climate Prediction, part of the UK Met Office. The other two records are derived from measurements made by satellites, and then compiled by Remote Sensing Systems (RSS) in California and the University of Alabama, Huntsville (UAH).
To fill in the huge gaps, those compiling the records have resorted to computerised “infilling” or “homogenising”, whereby the higher temperatures recorded by the remaining stations are projected out to vast surrounding areas (Giss allows single stations to give a reading covering 1.6 million square miles). This alone contributed to the sharp temperature rise shown in the years after 1990.
But still more worrying has been the evidence that even this data has then been subjected to continual “adjustments”, invariably in only one direction. Earlier temperatures are adjusted downwards, more recent temperatures upwards, thus giving the impression that they have risen much more sharply than was shown by the original data.
In reality, the implications of such distortions of the data go much further than just representing one of the most bizarre aberrations in the history of science. The fact that our politicians have fallen for all this scary chicanery has given Britain the most suicidally crazy energy policy (useless windmills and all) of any country in the world.
* * *
Seaonally-adjusted seasons? Sure, why not!
