– The Entire Farcical 2014 Market Summarized In One Chart (ZeroHedge, Jan 1, 2015):
If someone had just woken up and missed all of 2014, one look at the following chart of the S&P is all they need to know what happened:

In brief: the 45-degree “bottom left to top right” levitation on negligible volume that started several years ago, continued throughout 2014 with virtually no substantial incidents. In fact, every time there was an interruption, some central banker – be it Bullard or Yellen – stepped in and talked the market right back up, something even the BIS mocked a few weeks ago when it said:
… it would be imprudent to ignore that markets did not fully stabilise by themselves. Once again, on the heels of the turbulence, major central banks made soothing statements, suggesting that they might delay normalisation in light of evolving macroeconomic conditions. Recent events, if anything, have highlighted once more the degree to which markets are relying on central banks: the markets’ buoyancy hinges on central banks’ every word and deed.
Which is also the explanation why for the 6th year in a row hedge funds have underperformed what was once a “market”, and is now merely a “confidence building policy instrument.”
And yet, there are still those who still follow every up and, so very rarely, down-tick with morbid fascination. It is for their benefit that we present what in our, and Nanex’s, opinion was the absurd chart topping an absurd year of the most absurd “bull market rally” in history.
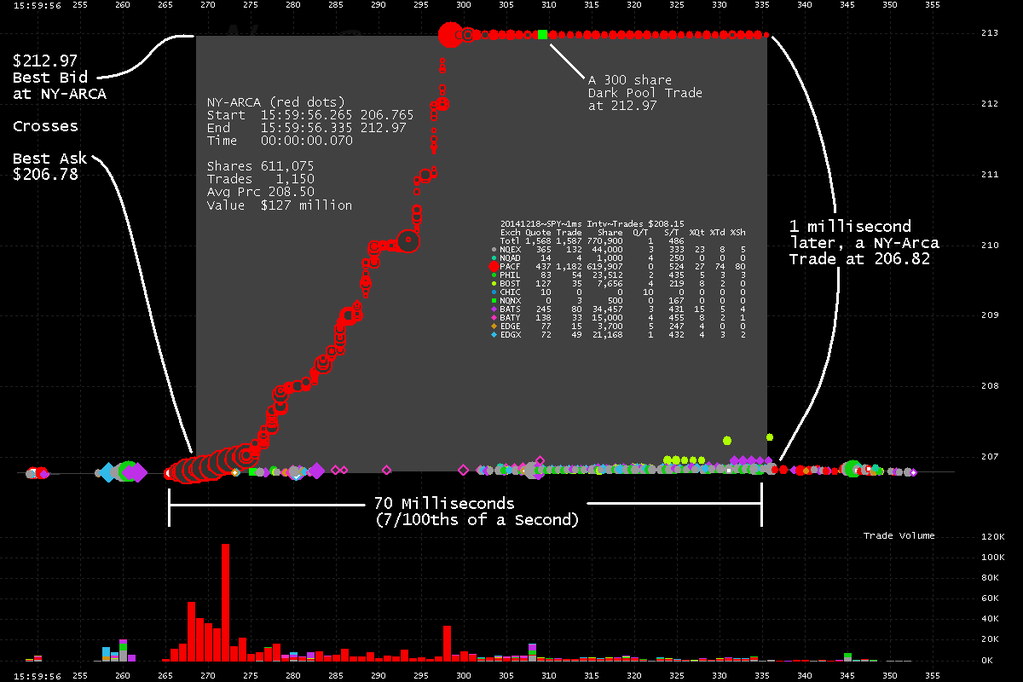
Presenting the Top 10 WTF moment of the broken market of 2014: the last second December 18, 2014 flash smash in the SPY. Because for all those who think 2094 was the all time high in the S&P, think again: according to whatever algo was trading the SPY 4 seconds before the close on December 18 the real all time high was actually 2130: appropriately enough, a fake “all-time high” attained only thanks to a algorithmic glitch.
Here is the moment of panic to push the SPY at all costs higher by 6 (60 S&P equivalent) points higher in what is a clear example of attempted momentum ignition by an unidentified trader, gone epically wrong, and caught for posterity thanks to Nanex.
That in itself would have been bad enough. But where it gets worse is that as we reported two days ago, virtually every futures exchange has now banned manipulative momentum ignition trading. Keyword being “manipulative.”
And the punchline: in any other market, except one manipulated by central banks themselves, the party responsible for the erroneous trades would have immediately stepped up and attempted to bust these “erroneous” trades: after all whoever bought the $200 million, or 611K shares, of SPY up to 3% above market, lost millions in the process.
But then again, if that someone was an entity that didn’t want to be unmasked and revealed as responsible for engaging in market-wide momentum ignition using the HFTs’ favorite DirectEdge exchange, the multi-million cost of not DKing the trades would be worth preserving one’s anonymity.
Which explains this:
- ALL TRADES IN ‘SPY’ WILL STAND
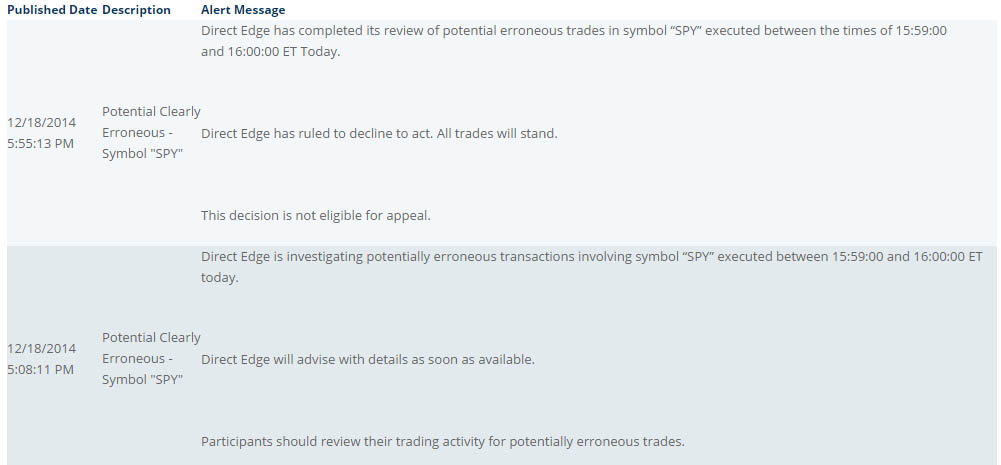
And this.
Conflict of interest…..shirley not!
http://www.blacklistednews.com/Top_Israeli_Central_Banker_is_The_Real_Power_In_The_Federal_Reserve/40500/0/38/38/Y/M.html