– The Screaming Fundamentals For Owning Gold (Peak Prosperity, April 4, 2014):
This report lays out the investment thesis for gold. Silver is mentioned only where necessary, as a separate report of equal scope will be forthcoming on that topic. Various factors lead me to conclude that gold is one investment that you can park for the next ten or twenty years, confident that it will perform well. Timing and logic for both entering and finally exiting gold as an investment are laid out in the full report.
The punch line is this: Gold (and silver) is not in bubble territory, and its largest gains remain yet to be realized; especially if current monetary, fiscal, and fundamental supply-and-demand trends remain in play.
Introduction
In 2001, as the painful end of the long stock bull market finally seeped into my consciousness, I began to grow quite concerned about my traditional stock and bond holdings. Other than a house with 27 years left on a 30 year mortgage, these paper holdings represented 100% of my investing portfolio. So I dug into the economic data to discover what the future likely held. What I found shocked me. It’s all in the Crash Course, in both video and book form, so I won’t go into that data here; but a key takeaway is that the US is spending far more than it is earning, and supporting that gap by printing a whole lot of new money.
By 2002, I had investigated enough about our monetary, economic, and political systems that I came to the conclusion that holding gold and silver would be a very good idea. So I poured 50% of my liquid net worth into precious metals, and sat back and waited.
So far so good. But the best is yet to come… unfortunately. I say ‘unfortunately’ because the forces that are going to drive gold higher in current dollar terms are the very same trends that are going to leave most people, and the planet, much worse off than they are now.
Part 1: Why Own Gold?The reasons to hold gold (and silver), and I mean physical bullion, are pretty straightforward. So let’s begin with the primary ones:
- To protect against monetary recklessness
- As insulation against fiscal foolishness
- As insurance against the possibility of a major calamity in the banking/financial system
- For the embedded ‘option value’ that will pay out handsomely if gold is re-monetized
Monetary Risk
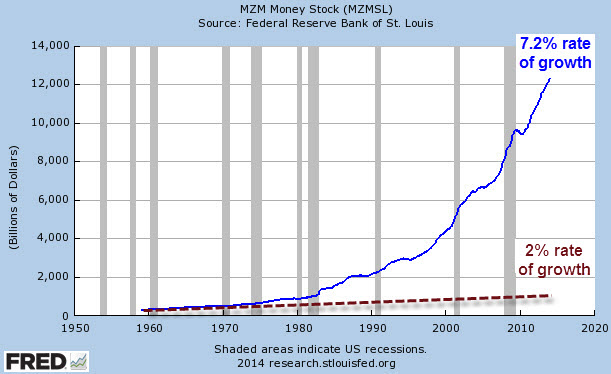
By ‘monetary recklessness,’ I mean the creation of money out of thin air and the application of more liquidity than the productive economy actually needs. The central banks of the world have been doing this for decades, not just since the onset of the 2008 financial crisis. In gold terms, the supply of above-ground gold is growing at 1.7 % per year, while the money supply has been growing at more than three times that yearly rate since 1960:
Over time, that more than 5% growth differential has created an enormous gap due to the exponential ‘miracle’ of compounding.
Now this is admittedly an unfair view, because the economy has been growing, too. But money and credit growth has still handily outpaced the growth of our artificially and upwardly-distorted GDP measurements by a wide margin. Even as the economy stagnates under this too-large debt load, the credit system continues to expand as if perpetual growth were possible. Given this dynamic, we continue to expect all the resulting extra dollars, debts and other assorted claims on real wealth to eventually show up in prices of goods and services.
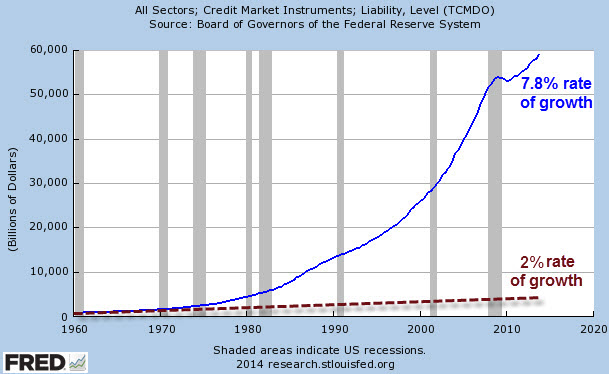
And since we live in a system where money is loaned into existence, we also have to look at the growth in credit, as well. Since 1970 the US has been compounding its total credit market debts at the astounding rate of nearly 8% per annum:
This desperate drive for continuous compounding growth in money and credit is a principal piece of evidence that convinces me that hard assets, of which gold is perhaps the star representative for the average person, are the place to be for a sizeable portion of your stored wealth.
Negative Real Interest Rates
Real interest rates are deeply negative (meaning that the rate of inflation is higher than Treasury bond yields). This is a forced, manipulated outcome courtesy of central banks that are buying bonds with thin-air money. Of course, the true rate of inflation is much higher than the officially reported statistics by at least a full percent or possibly two, and so I consider bond yields to be far more negative than your typical observer. Historically, periods of negative real interest rates are nearly always associated with outsized returns for commodities, especially precious metals. If and when real interest rates turn positive, I will reconsider my holdings in gold and silver, but not until then. That’s as close to an absolute requirement as I have in this business.
Dangerous Policies
Monetary policies across the developed world remain as accommodating as they’ve ever been. Even Greenspan’s 1% blow-out special in 2003 was not as steeply negative in real terms as what Bernanke engineered over his more recent tenure. But it is the highly aggressive and ‘alternative’ use of the Federal Reserve balance sheet to prop up insolvent banks and to sop up extra Treasury debt that really has me worried. There seems to be no way to end these ever-expanding programs, and they seem to have become a permanent feature of the economic and financial landscape. In Europe, the equivalent is the sovereign debt now found on the European Central Bank (ECB) balance sheet. In Japan we have prime minister Abe’s ultra-aggressive policy of doubling the monetary base in just two years. Suffice it to say that such grand experiments have never been tried before, and anyone that has the vast bulk of their wealth tied up in financial assets is making an explicit bet that these experiments will go exactly as planned.
Chronic Deficits
Federal fiscal deficits are seemingly out of control and are now stuck in the $1 trillion range. Massive deficit spending has always been inflationary, and inflation is usually gold/silver friendly. Although not always, mind you, as the correlation is not strong, especially during mild inflation (less than 5%). Note, for example, that gold fell from its high in 1980 all the way to its low in 1998, an 18 year period with plenty of mild inflation along the way. Sooner or later I expect extraordinary budget deficits to translate into extraordinary inflation.
Banking System Risk
Reason #3, insurance against a major calamity in the banking system, is an important part of my rationale for holding gold.
And let me clear: I’m not referring to “paper” gold, which includes the various tradable vehicles (like the “GLD” ETF) that you can buy like stocks through your broker. I’m talking about physical gold and silver because of their unusual ability to sit outside of the banking/monetary system and act as monetary assets.
Literally everything else financial, including our paper US money, is simultaneously somebody else’s liability. But gold and silver bullion are not. They are simply, boringly, just assets. This is a highly desirable characteristic that is not easily replicated.
Should the banking system suffer a systemic breakdown, to which I ascribe a reasonably high probability of greater than 1-in-3 over the next 5 years, I expect banks to close for some period of time. Whether it’s two weeks or six months is unimportant; no matter the length of time, I’d prefer to be holding gold than bank deposits.
During a banking holiday, your money will be frozen and left just sitting there, even as everything priced in money (especially imported items) rocket up in price. By the time your money is again available to you, you may find that a large portion of it has been looted by the effects of a collapsing currency. How do you avoid this? Easy; keep some ‘money’ out of the system to spend during an emergency. I always advocate three months of living expenses in cash, but you owe it to yourself to have gold and silver in your possession as well.
The test run for such a bank holiday was recently tried out in Cyprus where people woke up one day and discovered that their bank accounts were frozen. Those with large deposits had a very material percentage of those funds seized so that the bank’s more senior creditors, the bondholders, could avoid the losses they were due.
Most people, at least those paying attention, learned two things from Cyprus:
- In a time of crisis those in power will do whatever it takes to assure that the losses are spread across the population rather than taken by the relatively few institutions and individuals that should take the losses.
- If you make a deposit with a bank, you are actually an unsecured creditor of that institution; which means you are legally last in line for repayment should that institution fail.
Re-monetization Potential
The final reason for holding gold, because it may be remonetized, is actually a very big draw for me. While the probability of this coming to pass may be low, the rewards would be very high for those holding gold should it occur.
Here are some numbers: The total amount of ‘official gold,’ or that held by central banks around the world, is 31,320 tonnes, or 1.01 billion troy ounces. In 2013 the total amount of money stock in the world was roughly $55 trillion.
If the world wanted 100% gold backing of all existing money, then the implied price for an ounce of gold is ($55T/1.01BOz) = $54,455 per troy ounce.
Clearly that’s a silly number (or is it?). But even a 10% partial backing of money yields $5,400 per ounce. The point here is not to bandy about outlandish numbers, but merely to point out that unless a great deal of the world’s money stock is destroyed somehow, or a lot more official gold is bought from the market and placed into official hands, backing even a small fraction of the world’s money supply by gold will result in a far higher number than today’s ~$1,300/oz.
The Difference Between Silver and Gold
Often people ask me if I hold goldandsilver as if it were one word. I do own both, but for almost entirely different reasons.
Gold, to me, is a monetary substance. It has money-like qualities and it has been used as money by diverse cultures throughout history. I expect that to continue.
There is a slight chance that gold will be re-monetized on the international stage due to a failure of the current all-fiat regime. If or when the fiat regime fails, there will have to be some form of replacement, and the only one that we know works for sure is a gold standard. Therefore, a renewed gold standard has the best chance of being the ‘new’ system selected during the next bout of difficulties.
So gold is money.
Silver is an industrial metal with a host of enviable and irreplaceable attributes. It is the most conductive element on the periodic table, and therefore it is widely used in the electronics industry. It is used to plate critical bearings in jet engines and as an antimicrobial additive to everything from wall paints to clothing fibers. In nearly all of these uses, plus a thousand others, it is used in vanishingly-small quantities that are hardly worth recovering at the end of the product life cycle — so they often aren’t.
Because of this dispersion effect, above-ground silver is actually quite a bit less abundant than you might suspect. When silver was used primarily for monetary and ornamentation purposes, the amount of above-ground, refined silver grew with every passing year. After industrial uses cropped up, that trend reversed, and today it’s thought that roughly half of all the silver ever mined in human history has been irretrievably dispersed.
Because of this consumption dynamic, it’s entirely possible that over the next twenty years not one single net new ounce of above ground silver will be added to inventories, while in contrast, a few billion ounces of gold will be added.
I hold gold as a monetary metal. I own silver because of its residual monetary qualities, but more importantly because I believe it will continue to be in demand for industrial uses for a very long time, and it will become a scarce and rare item.
NOTE: PeakProsperity.com reserves its deeper analysis for our enrolled members, which is usually contained in Part 2 of our reports. Given the importance and widespread interest in this particular topic, we are exercising the rare exception to make Part 2 (below) available to the public.
Part 2: Supply & Demand Are Shockingly Out Of Balance
Gold Demand
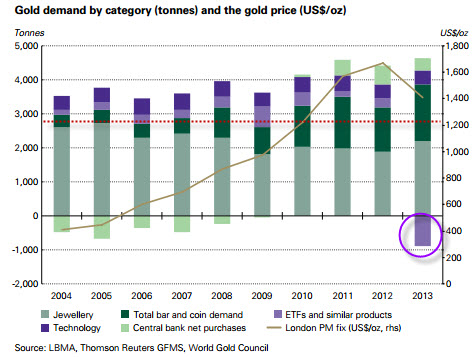
Gold demand has gone up from 3,200 tonnes in 2003 to 4,400 tonnes in 2013, and that’s even with a massive 800 tonnes being disgorged from the GLD tracking fund over 2013 (purple circle, below):
(Source)
Note the dotted red line in this chart: it shows the current level of mine production. World demand has been higher than mine production for a number of years. Where has the additional supply come from to meet demand? We’ll get to that soon, but the quick answer is: it had to come from somewhere, and that place was ‘the West.’
A really big story in play here is the truly historic and massive flows of gold from the West to the East, with China being the largest driver of those gold flows.
China
Alasdair McLeod of GoldMoney.com has assembled the public figures on China’s cumulative gold demand which, notably, do not include whatever the People’s Bank of China may have bought. Those are presumably additive to these figures unless we are to believe that the PBoC now purchases its gold over the counter and in full view (which they almost certainly do not).
Using publicly available statistics only, it’s possible to calculate that in 2013 China alone accounted for more than 2,600 tonnes of demand, or more than 60% of total demand or, as we’ll soon see, almost all of the world’s total gold mine production:
(Source)
Of course China has a lot of money to spend, a long and comfortable relationship with gold as a legitimate asset to hold, and has to be very pleased by the repeated bear raids in the western markets that drive the price of gold down, even as gold demand has surged to record highs as a consequence of these lower prices.
Of course the big risk in all that Chinese demand for gold is that China may stop buying that much gold in the future for a variety of reasons.
One could be that the Chinese bubble economy finally bursts and people there no longer feel wealthy and so they stop buying gold.
Another could be that the Chinese government reverses course and makes future gold purchases illegal for some reason. Perhaps they are experiencing too much capital flight, or they want to limit imports of what they consider non-essential items.
Who knows?
I do know that Chinese demand has been simply incredible and, keeping all things equal, I expect that to continue, if not increase.
India
India, long a steady and traditional buyer of gold, saw so much buying activity as a consequence of the lower gold prices that the government had to impose controls on the amount of gold imported into the country, even banning imports for a while:
(Source)
Central Banks
Another factor driving demand has been the reemergence of central banks as net acquirers of gold. This is actually a pretty big deal. Over the past few decades, central banks have been actively reducing their gold holdings, preferring paper assets over the ‘barbarous relic.’ Famously, Canada and Switzerland vastly reduced their official gold holdings during this period (to effectively zero in the case of Canada), a decision that many citizens of those countries have openly and actively questioned.
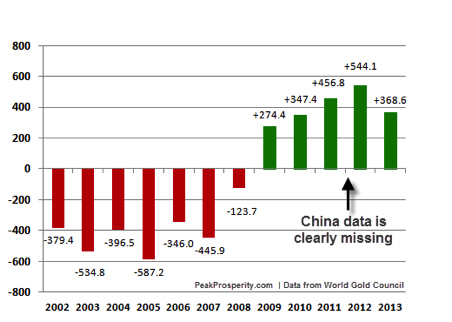
The UK-based World Gold Council is the primary firm that aggregates and reports on gold supply-and-demand statistics. Here’s their most recent data on official (i.e., central bank) gold holdings:
(Source)
Note that the 2009 data is lowered by slightly more than 450 tonnes in this chart to remove the one-time announcement by China that it had secretly acquired 454 tonnes over the prior six years, so this data may differ from other representations you might see. I thought it best to remove that blip from the data. Also, the data for 2012 and 2013 must also be lacking official China data because the last time they announced an increase in their official gold holdings was in 2009.
In just 2013 alone, the gap between China’s apparent and reported gold consumption was over 500 tonnes and the Chinese central bank, for a variety of reasons, is the most likely candidate to have absorbed such a quantity. If true, then China alone increased its official reserves by more than the rest of the world combined in 2013.
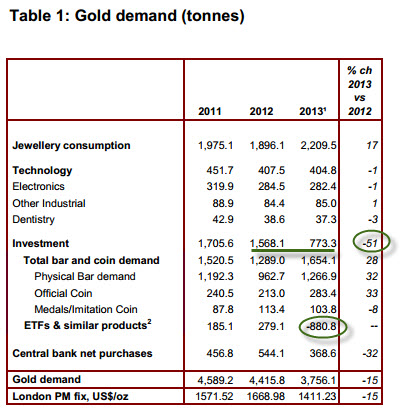
The World Gold Council puts out what is considered by many to be the definitive source of gold statistics, which are the source data for the above chart. I do not consider the WGC to be definitive since their statistics do not comport well with other well reported data, but let’s first take a look at what the WGC had to say about gold demand in 2013:
(Source)
The big story there, obviously is that investment demand absolutely cratered even as jewelry and coins and bars rose to new heights. And nearly all of that investment drop was driven by flows out of the GLD investment vehicle. That is, gold was chased out of the weak hands of mainly western investors and into the strong hands of Asian buyers who wanted physical bullion and jewelry.
This huge drop in total demand, led by plummeting investment demand, fits quite well with the 15% price drop recorded in 2013. So the WGC tells a nice coherent story so far.
But the problem with this tidy story is that it simply does not fit with the above data about China’s voracious appetite for gold, let along India’s steady demand and rising demand in Europe, the Middle East, Turkey, Vietnam or Russia.
The summary of the fundamental analysis of gold demand is
- there is a huge and pronounced flow of gold from the West to the East
- there is rising demand from all quarters except for the hot money GLD investment vehicle (which I have never been a fan of)
- all of this demand has handily outstripped mine supply which means that someone’s vaults are being emptied (the West’s) as someone else’s are rapidly filling (the East’s)
Now about that supply…Gold – Supply
Not surprisingly, the high prices for gold and silver in 2010 and 2011 stimulated quite a bit of exploration and new mine production. Conversely, the bear market from 2012 to 2014 has done the opposite.
However, the odd part of the story for those with a pure economic view is that with more than a decade of steadily rising prices, there has been relatively little incremental new mine production. For those of us with an understanding of depletion it’s not surprising at all.
In 2011 the analytical firm Standard Chartered calculated a rather subdued 3.6% rate of gold production growth over the next five years based on lowered ore grades and very high cash operating costs:
Most market commentary on gold centres on the direction of US dollar movements or inflation/deflation issues – we go beyond this to examine future mine supply, which we regard as an equally important driver. In our study of 375 global gold mines and projects, we note that after 10 years of a bull market, the gold mining industry has done little to bring on new supply. Our base-case scenario puts gold production growth at only 3.6% CAGR over the next five years.
(Source – Standard Chartered)
Since then, the trends for lower ore grade and higher costs have only gotten worse. But the huge drop in the price of gold in 2011 and 2012 was the final nail in the coffin and resulted in the slashing of CAPEX investment by gold mining companies.
Of course, none of this is actually surprising to anyone who understands where we are in the depletion cycle, but it’s probably quite a shock to many an economist. The quoted report goes on to calculate that existing projects just coming on-line need an average gold price of $1,400 to justify the capital costs, while green field, or brand-new, projects require a gold price of $2,000 an ounce.
This enormous increase in required gold prices to justify the investment is precisely the same dynamic that we are seeing with every other depleting resource: energy costs run smack-dab into declining ore yields to produce an exponential increase in operating costs. And it’s not as simple as the fuel that goes into the Caterpillar D-9s; it’s the embodied energy in the steel and all the other energy-intensive mining components all along the entire supply chain.
Just as is the case with oil shales that always seem to need an oil price $10 higher than the current price to break even, the law of receding horizons (where rising input costs constantly place a resource just out of economic reach) will prevent many an interesting, but dilute, gold ore body from being developed. Given declining net energy, that’s that same as “forever” as far as I’m concerned.
Just like any resource, before you can produce it you have to find it. Therefore the relationship between gold discoveries and future output is a simple one; the more you have discovered in the past, the more you can expect to produce in the future, all things being equal.
This next chart should tell you everything you need to know about where we are in the depletion cycle for gold, as even with the steadily rising prices between 1999 and 2011 (going from $300 and ounce to $1,900), gold discoveries plummeted in 1999 and remained on the floor thereafter:
(Source)
Here we see that the 1990’s decade saw quite a number of large discoveries that are currently in production but which were not matched in later years. Since it takes roughly ten years to bring a mine into full production following discovery, it’s fair to say that we are currently enjoying production from the discoveries of the 1990’s. Future gold production will largely be shaped by the discoveries made since then.
In other words: expect less gold production in the future.
Meanwhile, there will be more money, more credit, and more people (especially in the East) competing for that diminished supply of gold going forward.
Let’s take another angle on gold supply, but which circles back and supports the above chart showing fewer and smaller discoveries in recent years.
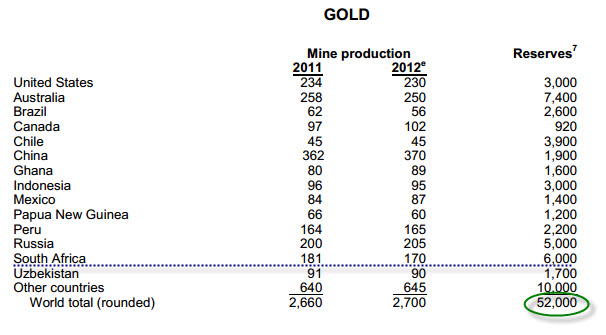
The United States Geological Survey, or USGS, keeps a mountain of data on literally every important mined substance. I think it’s staffed by credible people, doing good work, and I’ve yet to detect political influence in their reported statistics.
At any rate, the latest assessment on gold reveals that their best guess for world supply is that something on the order of 52,000 tonnes of reserves are left. Which means that, at the 2012 mining rate of 2,700 tonnes, there are 19 years of reserves left:
(Source)
This doesn’t mean that in 19 years there will be no more new gold to be had, as reserves are always a function of price; but it gives us a sense of what’s out there right now at current prices.
As much as I like the folks at the USGS, I will point out one glaring discrepancy in their data as a means of exposing why I think these reserves, like those for many other critical things like oil, are probably overstated. And that story begins with South Africa (highlighted in the table above with the blue dotted line.)
There you’ll note that, at 6,000 tonnes, South Africa has the second largest stated country reserves. However, according to official South African data, they claim to have an astonishing 36,000 tonnes of reserves. Which is right?
Neither as it turns out.
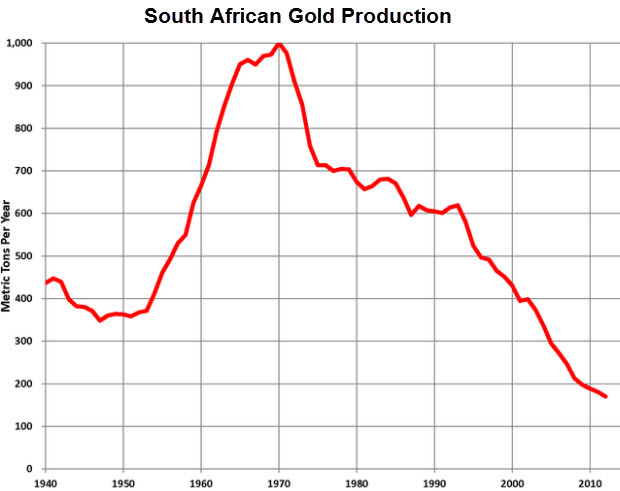
First, the true story of South African gold production is completely obvious from the production data. It’s a story of being well and truly past the peak of production:
(Source)
And not just a little bit past peak, but 44 years past; down a bit more than 80% from the peak in 1970. The above chart is simply not even slightly in alignment with the claims of the South African government to have 36,000 tonnes of reserves. But pity the poor South African government which knows that gold exports represent fully one third of all their exports. Of course they will want to claim massive reserves that will support many future years of robust exports.
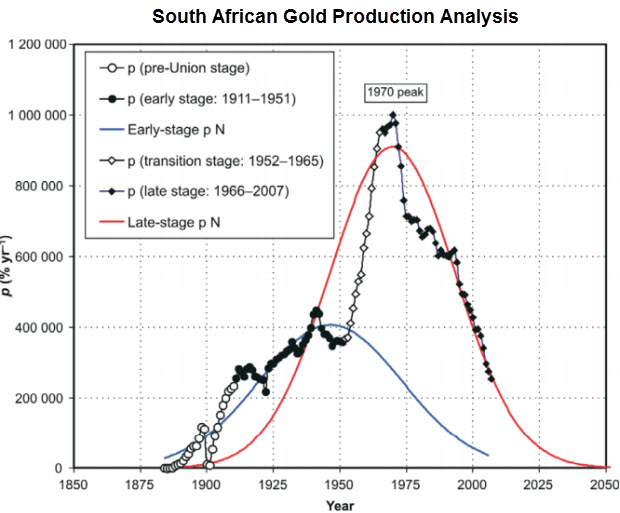
Instead, the South African production data can be modeled by the same methods as any other depleting resource and one such analysis has been done and arrived at the conclusion that there are around 2,900 tonnes left to be mined in South Africa.
(Source)
The analysis is quite sound; and the authors went on to point out that the social, economic, energy, and environmental costs of extracting those last 2,900 tonnes are quite probably higher than the current market value of those same tonnes. If they are extracted, South Africa will be net poorer for those efforts. This is the same losing proposition as if it took more than one barrel of oil to get a barrel of oil out of the ground – the activity is a loss and should not be undertaken.
For lots of political and economic reasons, however, gold mining will continue in South Africa. But, realistically, someone in government there should be thinking this through quite carefully.
The larger story wrapped into the South African example is this: perhaps there are 19 years of global gold reserves left (at current rates of production), but I doubt it.
Instead, the story of future gold production will be one of declining production at ever higher extraction costs — exacerbated by the 80,000,000 new people who swell the planet’s population every twelve months, the hundreds of millions of people in the East who enter the ranks of the middle class annually, and trillions of new monetary claims that are forced into the system each year.
And this brings me to my final point of this part of the public part of this report.
Scarcity
If we cast our minds forward ten years and think about a world with oil costing 2x to maybe 4x more than today, we have to ask ourselves some important questions:
- How many of our currently-operating gold and silver mines, or the base metal mines from which gold and silver are by-products, will still be in operation then?
- How many will simply shut down because their energy costs will have exceeded their marginal economic benefits?
After just 100 years of modern, machine-powered mining, all of the great ore bodies are gone, most of the good ones are already in operation, and only the poorest ones are left.
By the time you are reading stories like this next one, you should be thinking, Why are we going to all that trouble unless that’s the best option left?
South African Miners Dig Deeper to Extend Gold Veins’ Life Spans
Feb 17, 2011
JOHANNESBURG—With few new gold strikes around the world that can be turned into profitable mines, South Africa’s gold miners are planning to dig deeper than ever before to get access to rich veins.
The plans raise questions about how to safely and profitably mine several miles below the surface. Success would mean overcoming problems such as possible rock falls, flooding and ventilation challenges and designing technology to overcome the threats.
Mark Cutifani, chief executive officer of AngloGold Ashanti Ltd., has a picture in his office of himself at one of the deepest points in Africa, roughly 4,000 meters, or 13,200 feet, down in the company’s Mponeng mine south of Johannesburg. Mr. Cutifani sees no reason why Mponeng, already the deepest mining complex in the world, shouldn’t in time operate an additional 3,000-plus feet deeper.
“The most critical challenges for all of us in South Africa are depths and depletion of reserves,” Mr. Cutifani said in an interview.
The above article is just a different version of the story that led to the Deepwater Horizon incident. Greater risks and engineering challenges are being met by hardworking people going to ever greater lengths to overcome the lack of high quality reserves to go after.
By the time efforts this exceptional are being expended to scrape a little deeper, after ever smaller and more dilute deposits, it tells the alert observer everything they need to know about where we are in the depletion cycle, which is, we are closer to the end than the beginning. Perhaps there are a few decades left, but we’re not far off from the day where it will take far more energy to get new metals out of the ground compared to scavenging those already above ground in refined form.
At that point we won’t be getting any more of them out of the ground, and we’ll have to figure out how to divvy up the ones we have on the surface. This is such a new concept for humanity — the idea of actual physical limits — that only very few have incorporated this thinking into their actions. Most still trade and invest as is the future will always be larger and more plentiful, but the data no longer supports that view.
We are at a point in history where we can easily look forward and make the case for declining per-capita production of numerous important elements just on the basis of constantly falling ore grades. Gold and silver fit into that category rather handily. Depletion of reserves is a very real dynamic. It is not one that future generations will have to worry about; it is one with which people alive today will have to come to terms.
The issue of Peak Cheap Oil only exacerbates the reserve depletion dynamic by adding steadily rising energy input costs to mix. Should oil get to the point of actual scarcity, where we have to ration by something other than price, then we must ask where operating marginal mines slot onto the priority list. Not very highly, would be my guess.
Part 3: Protecting Your Wealth With Gold
For all the reasons above, it’s only prudent to consider gold an essential element of a sound investment portfolio.
In Part 3: Using Gold to Protect Yourself In Advance of the Greatest Wealth Transfer of Our Lifetime we detail out the specifics of how much of your net worth to consider investing in gold, in what forms to hold it, which price targets are gold and silver most likely to reach, and which eventual indicators (likely years away) to look for that will signal that it’s time to sell out of your precious metal investments.
The battle to keep gold’s price in check is truly one for the ages. Not because gold deserves such treatment, but because the alternative is for the world’s central planners to admit that they’ve poorly managed an ill-designed monetary system of their own creation. As a result, price manipulation is an additional important factor to be aware of, and to address in your accumulation strategy.
Make sure you’re taking steps today to ensure that the purchasing power of your wealth is protected, if not enhanced, when the trends identified above arrive in full force.
Click here to access Part 3 of this report (free executive summary, enrollment required for full access).

