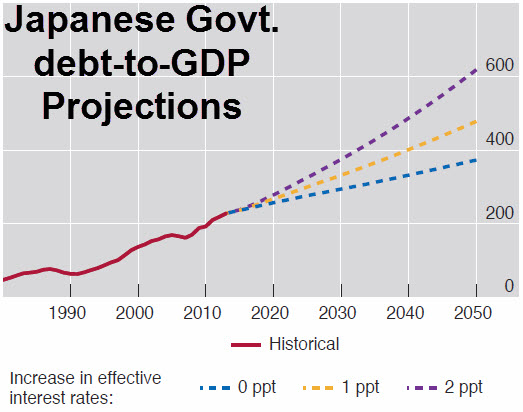
– The BIS Chart That Abe And Kuroda Would Rather You Didn’t See (ZeroHedge, June 24, 2013):
Earlier we noted the rather peculiarly truthful (lack of optimistically-biased bullshit) annual report from the BIS as reading ZeroHedge-sermon-like. There is a smorgasbord of data, charts, and quotes strewn throughout the 204-page melodrama but one caught our eye. Reflecting on the fact that governments in several major economies currently benefit from historically low funding costs, and yet at the same time, rising debt levels have increased their exposure to higher interest rates, the BIS projects the dismal reality that any rise in interest rates without an equal increase in the output growth rate will further undermine fiscal sustainability.Although predicting when and how a correction in long-term rates will unfold is difficult, it is possible to examine the potential impact on the sustainability of public finances and how any normalization of rates (or Abe’s success in creating 2% ‘inflation’ in Japan) leads the nation’s debt-ratio to explode (to over 600% debt-to-GDP).
What is more concerning is that even with no negative impact from demographics (age-related adjustments) and even assuming a central bank that can keep interest rates at their ultra-low levels for another 30 years, Japan’s debt-to-GDP ratio will reach almost 400% (that’s a best case scenario!!)
Unsurprisingly, the higher the interest rate, the faster debt will increase; and while the BIS and the central planners of the world clearly ‘believe’ they can manipulate JGB yields should this happen, we suspect there is a (non-specific R&R vs Krugman based) limit that once crossed creates the qualitative perception shift that Kyle Bass has so unequivocally explained is coming.
As we noted earlier from the BIS – “some policies have clearly hit their limit.”
Chart: BIS

1 thought on “The BIS Chart That Abe And Kuroda Would Rather You Didn’t See”