– America’s Tragic Future In One Parabolic Chart (ZeroHedge, Feb 23, 2013):
When it comes to forecasting the long-term trajectory of the US economy, things usually get very fuzzy some time after 2020 because, as even the most hardened optimists, the “impartial” Congressional Budget Office have recently admitted, America has at best 3-4 years before everything falls apart due to the unsustainable demographic crunch that will wallop the US entitlement state as demographics suddenly becomes a four letter word. Beyond that, not even the CBO dares to plot a straight line as to what happens should America not get its fiscal house in order.Which is why were were very surprised to see none other than Morgan Stanley’s David Greenlaw and Deutsche Bank’s David Hooper release a paper (whose views do “not necessarily reflect those of the institutions with which they are affiliated”) titled “Crunch Time: Fiscal Crises and the Role of Monetary Policy” which is a must read for everyone interested in what very likely will happen to the US as ever more power is handed over by the country’s now terminally malfunctioning fiscal and legislative apparatus to the monetary policy vehicle controlled by the US financial oligarchy.
Since we know that most readers are pressed for time, we will cut to the chase: the following chart shows what according to the authors’ own simulation of the US economy, and not that of the CBO, rates on the 10 Year will look like through 2037. The second chart shows what US debt-to-GDP will be for the next two and a half decades.
The charts need no commentary. Parabola #1 showing the yield on the 10 Year under the authors’ simulation:
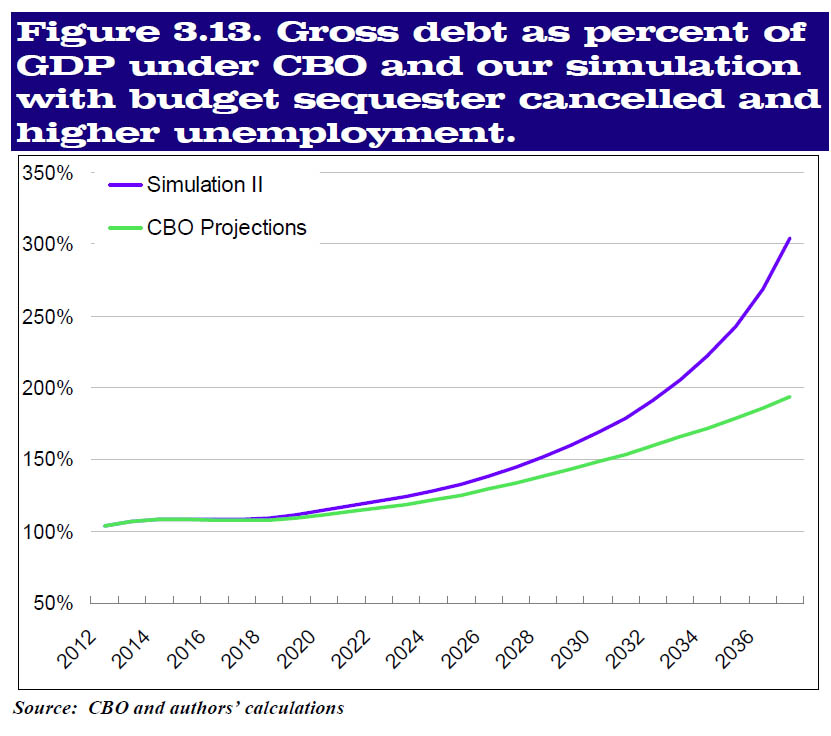
And Parabola #2 showing total US debt/GDP:
For those who request at least a little commentary, here it is:
[W]e have assumed the U.S. current account deficit holds at 2.5% of GDP– a level that matches the best result seen in the past decade and is slightly narrower than the 2.7% of GDP recorded in 2012. If, instead, we assume that the current account deficit reverted to the 3.7% of GDP average seen over the prior five years, then the projected debt burden would reach 180% of GDP in 2037.
We can also examine a scenario in which policy actions and economic outcomes produce a less favorable path for the primary budget deficit (using our baseline current account deficit assumption of 2.5% of GDP). For example, suppose that the looming budget sequester scheduled to occur on March 1 is cancelled and that the steady-state unemployment rate is assumed to be 6% (as opposed to the 5.25% as assumed by CBO). In this case (which we refer to as Simulation II), the budget deficit would be quite a bit higher than in the initial scenario. The debt/GDP ratio would rise much more rapidly, hitting 304% of GDP by 2037 (Figure 3.13) and bond yields would skyrocket, eventually getting above 25% (see Figure 3.14).
We should emphasize that we are not presenting these alternative simulations as more realistic forecasts of what the U.S. experience will actually be. In a country like the United States, the debt premium presumably would arise from inflation fears rather than concerns about outright default. And if we are talking about a higher inflation rate, forecasts of nominal GDP should be adjusted as well. Instead, we view these simulations as illustrating the extent to which the path implied by baseline CBO projections could quickly become much more difficult to manage than some policy-makers may be assuming– something dramatic will need to change well before U.S. interest rates reach double-digit rates
Our main conclusion is that higher debt levels can have a significant impact on the interest rate path and that feedback effects of higher rates on the level of indebtedness can lead to a more dramatic deterioration in long-run debt sustainability in the United States than is captured in official baseline estimates. Figure
Putting some numbers to the forecast by Greenlaw and Hooper, and assuming a 1.5% CAGR for GDP, which in the new structurally slower normal is quite generous, we get $23 trillion in US GDP by 2037, $70 trillion in debt, and a blended cash interest expense that is over 75% of total GDP.
We also get the Fed monetizing all of it.

